Executive Summary
Almonty Industries Incorporated (“Almonty”) (TSX:AII)(ASX:AII)(OTCQX:ALMTF)(Frankfurt:ALI.F) is a Canadian company that is focused on developing tungsten projects in “conflict-free countries”. It particularly emphasises that it can “fill the supply gap after China, which currently produces 80%+ of global tungsten, restricted exports and recently announced U.S. defense bans on tungsten imports set to begin in 2027”. This resonates well lately.
The company has been around since 2011 and has been producing since 2013. However, its performance has been very lacklustre, and Almonty was forced to close two operations and scale down production since 2018 at another mine called Panasqueira, located in Portugal. Currently, it generates only US$30 million in revenue on an annual basis, and this is without generating positive cash flow. Cumulatively until 30 June 2025 Almonty has been cash negative to the tune of C$210 million, which it covered by raising C$233 million, of which C$65 million was accounted for by equity placements. The cash balance increased by almost C$24 million from 2013 until 30 June 2025. Not much can therefore be expected from its current operations.
Almonty has, however, a project in South Korea, the Sangdong mine, which closed in 1992, but according to Almonty, is one of the world’s largest and highest-grade tungsten deposits. Below this deposit, molybdenum mineralisation is present, but it was never drilled out properly, and no mineral resources have ever been defined. The company’s actions since December 2024 have been to play heavily on the US sentiment to become less dependent on supplies from China. To this end, it has decided to reshape itself as a US-based company. This will allow it to present itself as the “only US-based tungsten provider”. It has played well with the market, and its share price has skyrocketed since December 2024, reaching C$5.92 by 21 August 2025. This attracted the attention of Crux Investor and is the reason for the review and valuation. As the company’s share performance seems to be determined by the development and imminent completion of the refurbishment of the Sangdong mine, this report has ignored the other projects and focused on Sangdong.
A technical report dated June 2025 is the main source of information about the plans for future mining. The company has indicated it wishes to expand production after start-up, but that is still not certain and is unlikely, as will be explained below.
The technical report was drafted by a single person, which has the disadvantage that this person cannot be an expert on all aspects of a mine project and misses the support of a peer reviewer. A peer review could have identified information gaps and inconsistencies. Crux Investor has found it very difficult to comprehend what is presented in the technical report at times and has encountered numerous discrepancies.
The tungsten mineralisation at Sangdong is contained in several tabular zones that dip at a very moderate angle slightly east of north. These zones have been called from top to bottom the Hanging Wall (“HW Zone”), Main and Footwall horizons. The Footwall zone comprises multiple layers, the most important of which are F1, F2 and F3. F1 occurs 1 m below the Main horizon and is approximately 2 m thick. Historical production has predominantly been derived from the Main zone and the F1, F2 and F3 zones. The HW zone has been mined to a minor extent. The HW zone is, however, now the main deposit for mineral resources.
Crux Investor has some major reservations about how the mineral resource estimation (“MRE”) has been conducted using different approaches for the HW zone and all other zones. Nowhere is it explained why the different approaches are warranted. One of the probable reasons is that mineralistion within the HW Zone is inconsistent and does not allow for neat wireframing as in the other zones. Review of cross sections show that the HW Zone has been drilled poorly compared to the other zones. The fact that this zone was mined to only a minor extent should also be a reason for caution.
The mineral reserves are defined based on two mining methods that account for the poor ground conditions at Sangdong. One of the methods is for the HW Zone, and the other is for all other zones. The HW zone will be mined with little dilution (= waste mined with ore), but a mining recovery (proportion of resource mined) of 85%, whereas mining the other zones will have a very high extraction rate, but with 24% dilution. Overall, 90% of the tungsten contained in mineral resources is forecast to be mined at an average grade that is 83% lower than the resource grade. Crux Investor records that the mineral reserve statement makes no sense as, not for the other zones, but the grade from HW mining is 24% lower than for its resources. Moreover, one particular zone suddenly yields almost 50% more metal than in its mineral resources.
Crux Investor has adopted the metallurgical performance as suggested in the technical report, but notes that no historical processing performance is provided as a reality check.
Two scenarios have been modelled: the Almonty case, and the Crux Investor case. Modelling the Almonty case serves as a check that there have been no oversights and to see whether or not the calculated taxes are close. In fact, it was found that the two models correlate well, except that Crux Investor has lower taxes by including C$33 million “non-capital losses” as per the 2024 annual financial statements.
The Crux Investor case further differs from the Almonty case by assuming a tungsten price that is 11% higher, but also assuming much higher mining and general and administration (“G&A”) costs and accounting for corporate expenses. The mining cost rate of US$25.2/t suggested by Almonty is not credible for the poor rock conditions, the suggested mining methods and poor economies of scale. The same applies to the suggested G&A, which would amount to only US$3.2 million per annum. Crux investor has used the mining cost of US$45/t, which is probably still far too low, and G&A of US$10 million per annum.
The two cases arrive at NPV8’s of US$296 million for the Almonty case and US$174 million for Crux Investor case. Both values are much lower than the diluted Enterprise Value of US$1,090 million on 21 August 2025. It means that, even according to Almonty, the value of the project is much lower than the market now reflects. In fact, the life of mine (“LOM”) revenue only slightly exceeds the Enterprise Value. Sensitivity analysis shows that the tungsten price needs to be 175% higher than the modelled price.
And prospects for expansion? Not credible at all. Firstly, mineral resources will have to be defined far from where current drilling information is available. Secondly, mining has focused on the central portion above the intrusion responsible for the mineralisation. As the zones are followed outwards, the grade drops. This is why historical production started at a grade of 1.21% WO3 and dropped to 0.53% upon mine closure. Finally, the narrow zones and poor ground conditions do not lend themselves to producing at a high rate.
Crux Investor, therefore, concludes that the market has been caught up in the hype and Almonty is vastly overvalued.
Introduction
Almonty Industries Incorporated (“Almonty”) (TSX:AII)(ASX:AII)(OTCQX:ALMTF)(Frankfurt:ALI.F) is a Canadian company focused on tungsten projects.
The company was incorporated in September 2009 and made its qualifying transaction for listing on the TSX in 2011. The transaction involved the acquisition of the company that owned the Los Santos mine in Spain and an option to purchase the Valtreixal tungsten project in Spain (exercised in December 2016). This transaction was followed in 2014 by the acquisition of Wolfram Camp Mine in Queensland, Australia. Continuing with its strategy of acquiring tungsten projects, Almonty entered a phase during which it purchased other such assets on an annual basis: in 2015, the Sangdong mine in South Korea and in 2016, the Panasquiera mine in Portugal. As of January 2016, the company had three operating mines and one closed-down mine, Sangdong, which it intended to return to production.
However, matters soon took a turn for the worse. Crux Investor has graphed in Figure 1_1 the financial performance since the first financial year ending September 2013 for which annual statements are available. The 2025 numbers have been annualised.

As shown above, in 2019, the year-end changed to 31 December.
The above graph shows the company has been almost consistently cash negative after accounting for investments.
Cumulatively, until 30 June 2025, it was cash negative to the tune of C$210 million, which it covered by raising C$233 million, of which C$65 million was accounted for by equity placements. The cash balance increased by almost C$24 million.
The graph also shows the average tungsten price for each period as reported by Almonty. The price is expressed in metric tonne unit (“MTU”) tungsten in the form of ammonium paratungstate (“APT”). Tungsten concentrate is typically priced at a discount to the price of APT, with concentrate vendors receiving about 70-80% of the APT price. This discount reflects the cost and effort required to refine tungsten concentrate into APT.
Almonty’s timing of acquisitions was unfortunate. The APT price collapsed in 2016, but it has been recovering since.
The consequence of the price collapse was the closure of the Wolfram Camp Mine in 2016 financial year, and of Los Santos in the 2018 financial year. Almonty decided in 2018 to cease expenditure on the refurbishment of the Wolfram Camp mine altogether and to place its holding companies in voluntary liquidation. It meant that in the 2019 financial year the company had only one operating mine, Panasquiera, for which it did not provide operating statistics in its Management Discussion and Analysis (“MDA”) reports as from the 2018 financial year. However, because revenue dropped dramatically after 2018, it is evident that the mine contributed only C$20 million per annum despite the increase in APT prices. Cash from operations net of investments saw a precipitous drop reaching a negative C$58 million in 2024 and negative C$87 million for H1 2025 annualised. Whereas cash was negative on an operational level, investments at Sangdong were responsible for most of the cash outflow.
In light of the above, the skyrocketing share price since December 2024, as shown in Figure 1_2, is intriguing:
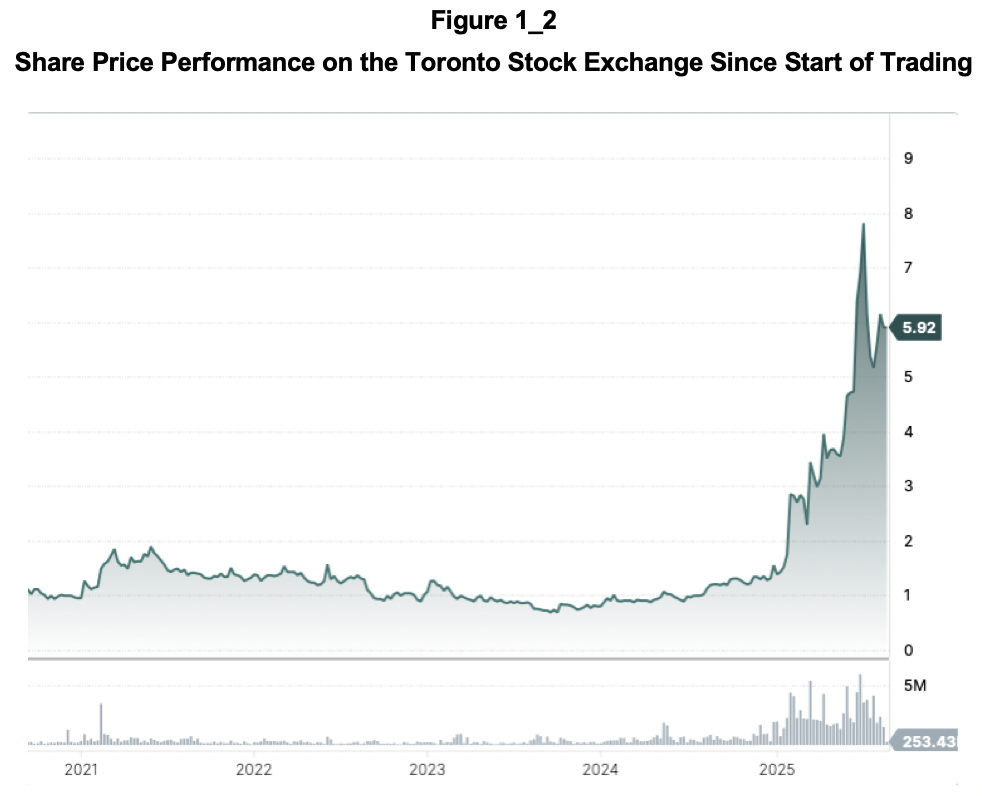
The sudden price explosion has attracted Crux Investor to look deeper into the company’s prospects.
Developments Since December 2024
Compared to the 2022 – 2024 period, the spot price is not much higher, trading at an average of US337/t MTU APT during the March 2025 quarter. In other words, the share price rise has been dominantly influenced by other factors other than the spot tungsten price.
A review of the press releases since late 2024 shows the following main events have occurred:
- On 21 November 2024, it was announced that the grinding circuits for the Sangdong processing plant had arrived. The market could now see that progress was finally made at erecting and completing this plant. Progress has been unexplainably slow at Sangdong. As far back as March 2018, the company had entered into a “new off-take agreement with an existing customer”. In January 2020, the company had received “a binding commitment letter from the KfW-IPEX Bank for the proposed project financing for the development and operation of the Company’s Sangdong Mine”. The MDA report for the year ending 31 December 2020 also advised that “Almonty had entered into an engineering, procurement and construction (“EPC”) contract with S – Material Hanlding Co Ltd for the development work at the Sangdong Mine”. The MDA for 2022 includes the statement that “Meanwhile, work is continuing at the Sangdong site to ensure timely commissioning as requested by Almonty’s customer”. Note that the term commissioning implies advanced development and construction. The MDA report for the quarter ending 30 June 2025 finally indicates that “the Sangdong Mine is fully permitted, and the Company expects construction at the Sangdong Mine in the second half of 2025.” It seems that the much-delayed planned production will finally end with imminent production starting in the coming months. This will definitely have comforted the market. The MDA reports do not explain precisely what is behind all the delays.
- In January 2025, Almonty announced that it had entered into an offtake agreement with the largest processor of molybdenum products in South Korea for 100% of the material produced. Production is expected by the end of 2026. It has not been explained how this will be accomplished without the company having established its molybdenum mineral reserves at Sangdong.
- In February 2025, Almonty received approval for domestication in the USA, positioning Almonty to become the only U.S.-based company producing tungsten concentrates at a commercial scale.
- In March 2025, Almonty entered into a strategic partnership agreement with American Defence International Inc. (“ADI”), a government relations and business development firm based in Washington, D.C.
- In May 2025, Almonty announces the execution of a binding Offtake Agreement with Tungsten Parts Wyoming, Inc. (“TPW”), a U.S.-based defense contractor, and Metal Tech (“MT”), a tungsten processor based in Israel.
- In June, the company announced that Alan Estevez would be appointed to its Board of Directors effective 30 May 2025. Mr. Estevez is a “nationally recognised authority in national security, defense logistics, and strategic trade.”
- Also, in June, the company announced receipt of a formal letter from the Chairman and Ranking Member of the U.S. House Select Committee on the Strategic Competition Between the United States and the Chinese Communist Party. Almonty states, “The letter underscores Almonty’s strategic importance to the United States as it seeks to secure critical mineral supply chains amid rising geopolitical tensions”.
- In July, there was an announcement that Almonty had filed an “updated” technical report for the Sangdong mine.
The above indicates that the company has been positioning itself to be supported by the US government.
In June, the “updated” MRE technical report was released. This is a misnomer, as the mineral resource statement is unchanged from 2016. The document is almost identical, except for including some additional metallurgical testwork, including a table to substantiate the assumed cut-off grade and a change in suggested mining methods.
From the above, it is evident that developments around Sangdong determine the recent price history. The only other operation, Panasquiera, has been unable to generate positive cash flow and its reserves of 1.95 million tonne (“Mt”) effective 31 September 2016, declared in a technical report dated 31 December 2016 was sufficient for a 3-year LOM at the production rate of 0.6 – 0.7 million tonnes per annum (“Mtpa”) at the time. For the purposes of this valuation, Panasquiera can be ignored as supporting the market capitalisation of C$1.28 billion on 21 August 2025.
The following section will review Sangdong and its capacity to deliver the financial performance necessary to support Almonty's Enterprise Value.
Valuation of the Sangdong Project
Background
The information in Sections 3.1 to 3.6.5 of this report is derived from a NI 43-101 compliant technical report dated 23 June 2025 reporting on the findings of a mineral resource estimation (“MRE”) and authored by a single person, Adam Wheeler, who was also responsible for the 2016 report. Since then, no further drilling has been carried out. Any amendments by Crux Investor will be clearly signalled.
Crux Investor records that Mr Wheeler is a mining engineer. Usually, a specialist resource geologist would sign off on the mineral resources. Moreover, having a single author, no peer reviewer could have pointed out to the author when the explanations were not clear on specific points and corrected internal inconsistencies. Crux Investor has found reviewing the document confusing, unclear and inconsistent in many instances, as demonstrated below.
The deposit is located at Sangdong in the south-eastern Korean Peninsula, about 170 km east-south-east of the capital city of Seoul, 25 km southwest of Taebaek and 55 km south-east of Wonju (see Figure 3.1_1).
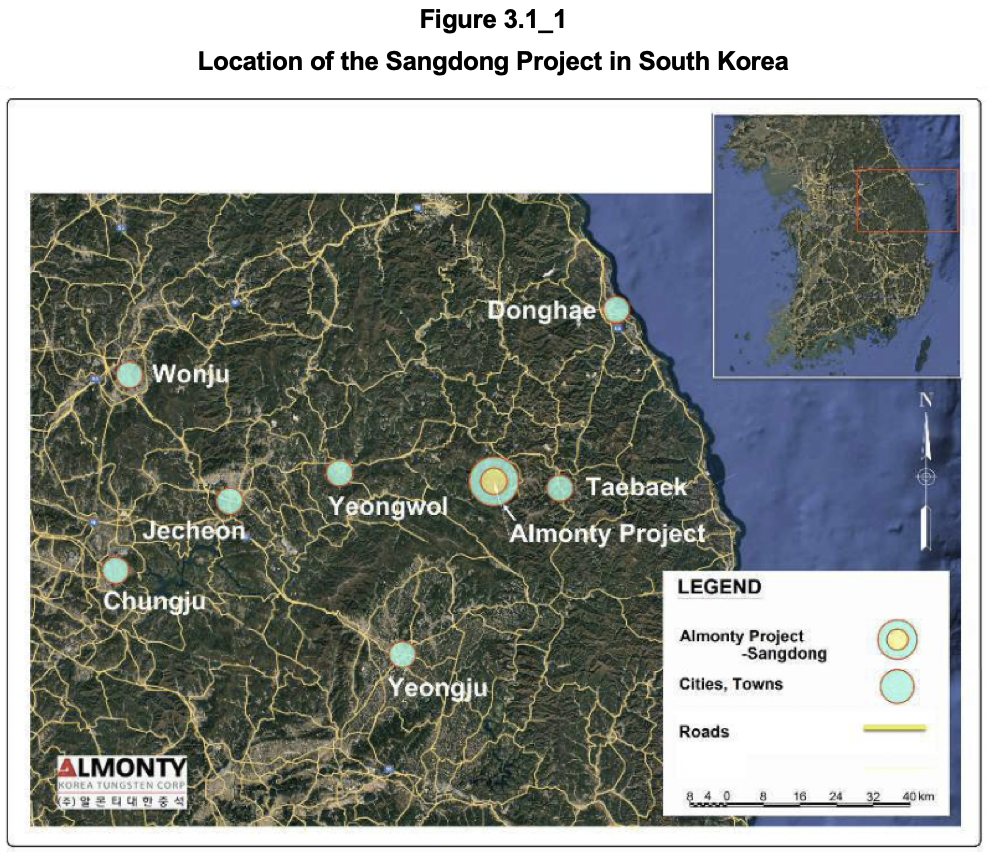
The project area is well served by Expressways and paved roads. The 175 km from Seoul can be covered in 3.5 hours. Sangdong is located 5 km south of the Yemi railhead, from which bulk cargo transport can also be arranged. Infrastructure is readily available, with two high-tension power lines crossing the property and a new power line offering 20 MVA capacity.
The project area comprises 12 mining rights covering almost 32 km2. The company was granted a 20-year extension on 13 May 2025. No royalties are applicable, but a 0.5% local resource and facility tax levied on the value of mined material is due to the local government.
Geology and Mineralisation
The tungsten mineralisation at Sangdong is contained in several tabular, bedding conformable “skarns” within a shale unit. Skarns are carbonaceous rocks, such as limestone and dolomite, that are altered by fluids emanating from a crystallising igneous rock to a “calc-silicate rock” with the calcium derived from the original rock and the silica from the mineralising fluids. The Sangdong skarns have been interpreted as carbonate horizons altered and mineralised by hydrothermal fluids ascending from the underlying Sangdong Granite.
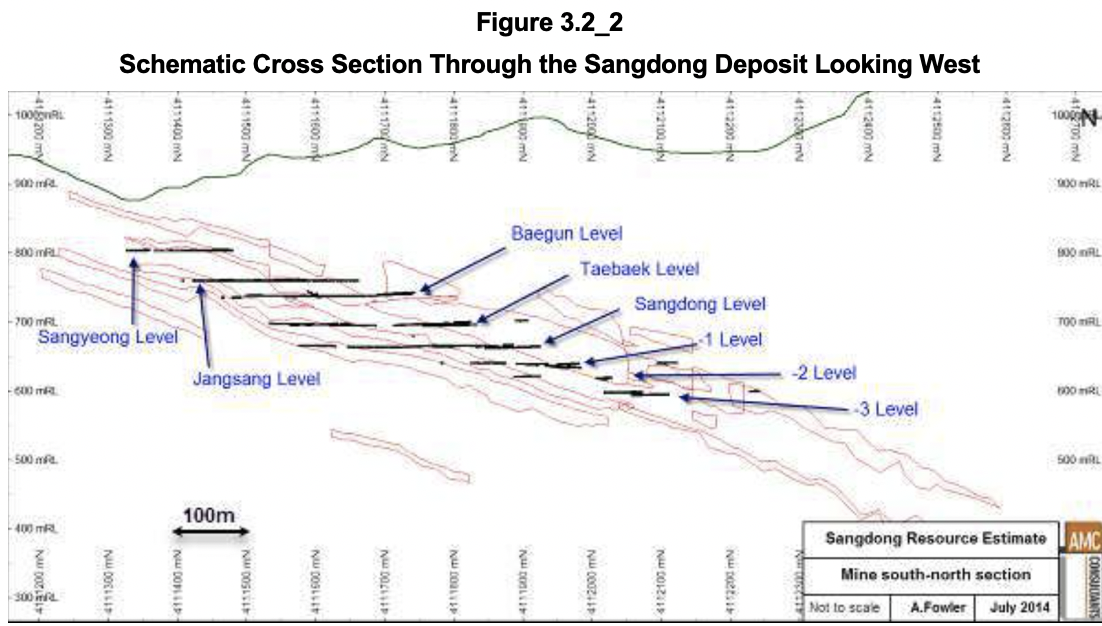
The skarn horizons are referred to from top to bottom, the Hanging Wall (“HW Zone”), Main and Footwall horizons. Figure 3.2_1 shows a schematic cross-section of the Sangdong deposit with the relative position of the horizons. The horizons can be seen to be dipping generally around 25 degrees NNE.
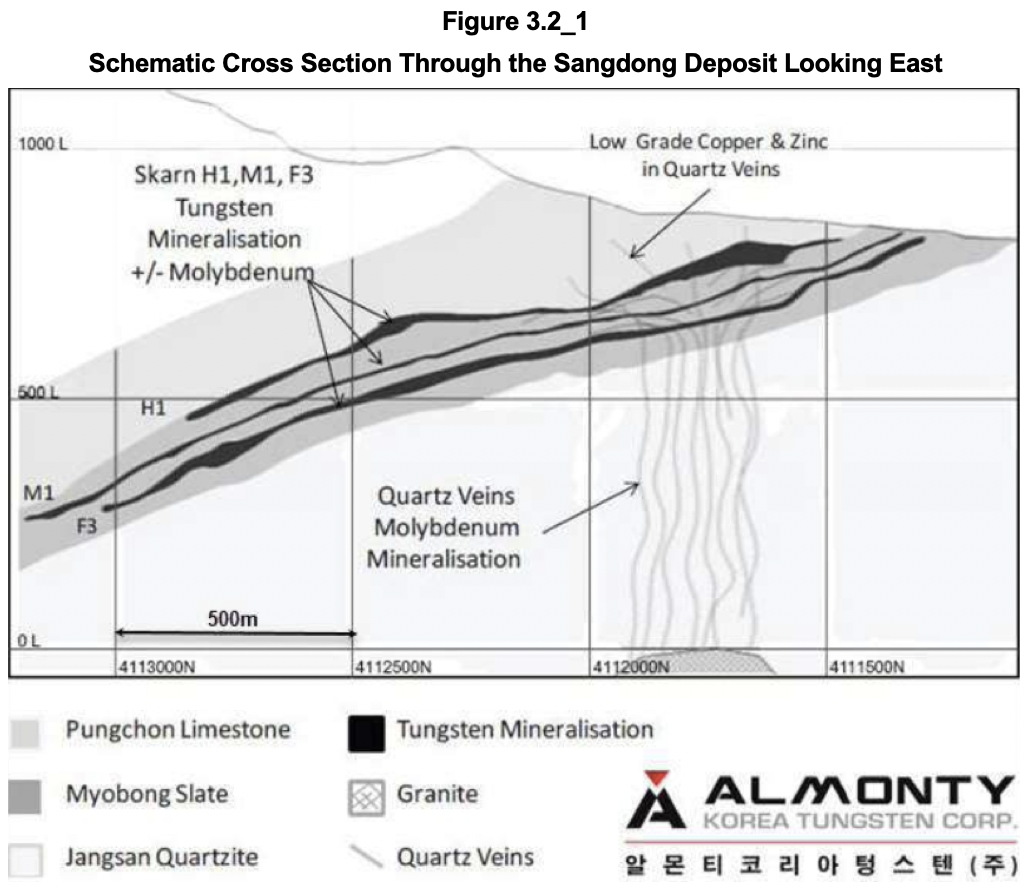
Mineralisation is not present over the total width of the horizons, but is primarily associated with swarms of quartz veins within those horizons, except the central portion of the HW horizon. Quartz veins are most abundant within a central, quartz-rich portion of the deposit, parallel to and discordant with the calc-silicate layering. Veining ranges from one to a few tens of centimetres in width and is best developed in the lower portions of the mineralised horizons.
The HW horizon varies in thickness from approximately 5 m to 30 m because of the irregular shale boundary with the overlying limestone. The maximum thickness is over 100 m and occurs near the centre of the deposit. The zone has a strike length of about 600 m and a down-dip extent of about 800 m. The base of the HW horizon is approximately 14 m above the upper contact of the Main horizon. The HW horizon has seen minor historical mining. This is probably due to tungsten mineralisation here being more variable and less clearly concentrated in zones.
The Main horizon strikes about 100° and dips northerly between 15° and 30°. The strike length exceeds 1,300 m, and the thickness varies from 5 m to 6 m. Hydrothermal alteration within the Main horizon forms three concentric, roughly circular zones with the best tungsten grades in the central quartz-rich zone, which has a diameter of 350 m. Surrounding the central zone are respectively a hornblende-rich zone and a diopside-rich zone. Unfortunately, the technical report does not discuss typical tungsten grades for these zones and how they compare to the central zone. There is only a qualitative statement “the abundance of scheelite (= CaWO4) within the mined portion of the Main horizon is concentrically zoned, increasing with alteration intensity, depending on temperature and on the oxidation conditions”.
The Footwall horizons comprise multiple layers, the most important of which are F1, F2 and F3. F1 occurs 1 m below the Main horizon and is approximately 2 m thick. F2 and F3 are approximately 35 m to 40 m below the Main horizon and are typically 3 m to 4 m thick. Further Footwall Zones have been identified below F3 and are collectively called F4 and F5. The lateral dimensions of these horizons and the zonal distribution of calc-silicate minerals are similar to those of the Main horizon. The F1 zone has sometimes been mined with the extraction of the Main Zone. Some parts of F2 and F3 have been mined in the upper section of the mine.
The mineralised zones have been affected by steeply north-dipping reverse and normal faults, which have resulted in offsets of the mineralised horizons by as much as 50 m to 100 m. Within the deposit are areas of smaller faults, typically spaced 50 m apart. The vertical throw of these faults is typically 1-4 m.
Molybdenum and bismuth are concentrically zoned in a similar pattern to tungsten in the Main horizon.
It is difficult to properly understand the extent and consistency of the mineralised veins and lenses from the technical report. For example, it includes the section below with the red outlines supposedly indicating a grade above 0.1% WO3.
Yet that information conflicts with Table 10-3 of the technical report, which Crux Investor reproduces below in Table 3.2_1, summarising the true thicknesses of the intersections and associated grades.
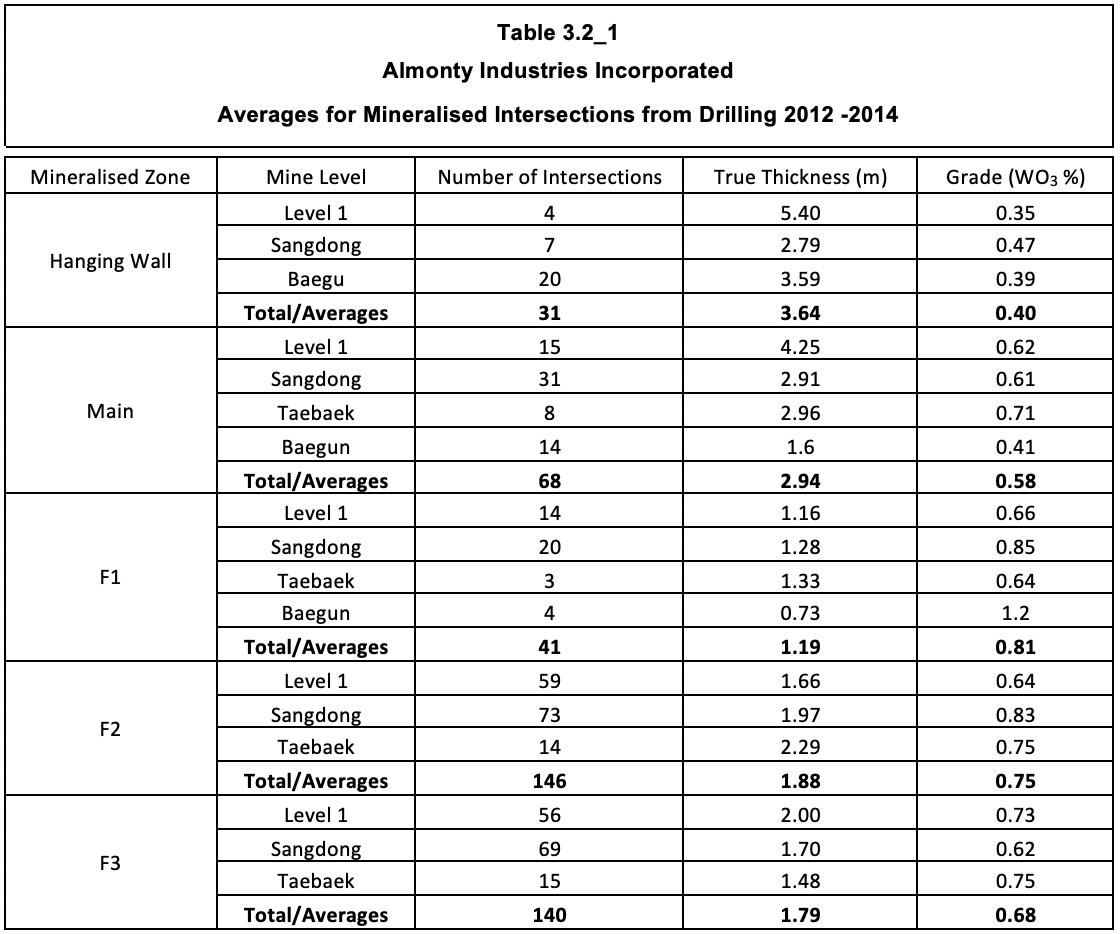
The table indicated that the average true thickness of the HW Zone intersections is just above 3.6 m, for the Main Zone under 3.0 m, for F1 approximately 1.2 m, for F2 approximately 1.9 m and for F3 approximately 1.8 m. How the outlines in Figure 3.2_2 were generated is unclear. It is possible that intersected lengths were smeared to a width within which the grade remains above 0.1% WO3.
Mineral Resources and Mineral Reserves
Mineral Resources
Company geologists interpreted skarn zones based on lithological interpretation for mineral resource estimation and applied a 0.1% WO3 threshold grade.
For the HW zone, the top and bottom contacts of the skarn were modelled. For all other zones, the centre points of the mineralised intersections were used to generate a digital terrain model, and the intersection's width was used to model the zone’s outlines.
Table 3.3.1_1 reproduces the overall dimensions derived for the various zones, suddenly introducing a “HALO” zone not previously discussed. Apparently, it refers to mineralisation surrounding the Footwall Zones 2 and 3.
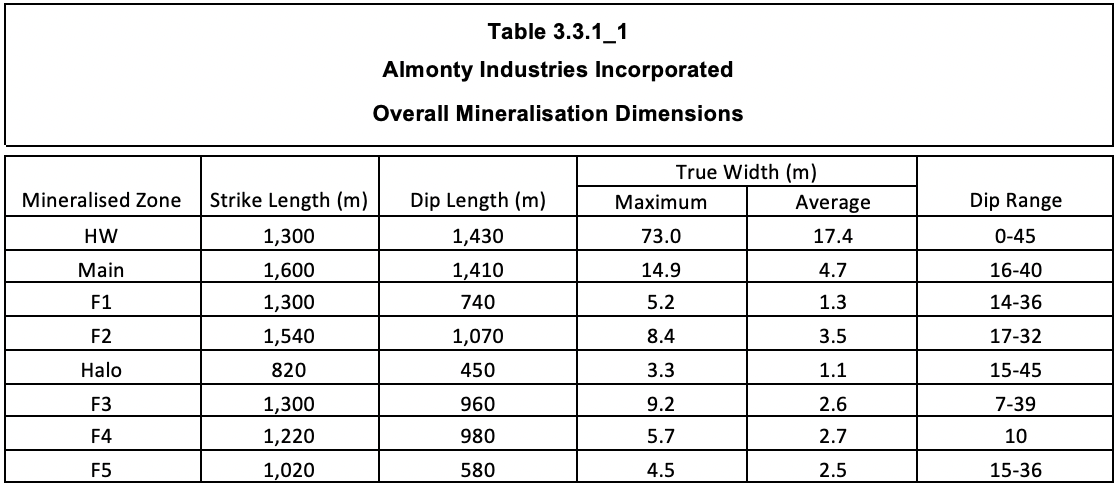
With the different approach to outlining the HW zone by modelling the skarn outline, the table gives the impression that this is by far the largest resource. However, this is misleading as mineralisation with a grade exceeding 0.1% WO3 is only within certain portions of the skarn. That is why the summary statistics provided for the composite lengths do have information on their true thickness for the various zones, except for the HW Zone. It makes for a confusing picture.
Before compositing assays, top-cut levels were determined for the WO3 and Mo grades in the various zones. The confusion goes further with a composite length of 5 m specified, but applied “as slightly variable”. It gets worse as the technical report also states a minimum composite length of 0.3 m.
The presented semi-variograms for the Main and HW zones look well defined and supported by sample data.
Two block models were generated: for the HW zone, 10 m x 10 m x 10 m, and for all other zones, 10 m x 10 m x the vertical height of the zone, with a minimum thickness of 2 m. For both models, subblocks were generated down to 5 m x 5 m in the XY directions.
For grade estimation, the HW zone needed a different approach from the one used for all other zones, which applied ordinary kriging for vertical thickness and grade accumulations (grade x thickness). For the HW zone, it was required first to flag blocks as either mineralised or waste by flagging composites as waste or mineralised.
For reporting of available mineral resources, mined-out limits were applied, and a 50 m remnant pillar below the surface topography was modelled.
For the reasonable prospect for eventual economic extraction (“RPEEE”) criterion a cut-off grade of 0.15% WO3 was assumed based on a price of US$450/MTU APT (which is high), and a mining cost of US$25.2/t which is very low for underground mining.
According to the author, Table 3.3.1_2 gives the mineral resource statement, effective 28 December 2024. Crux Investor has left out numbers for F5 as irrelevant for the valuation, as these are not converted to mineral reserves.
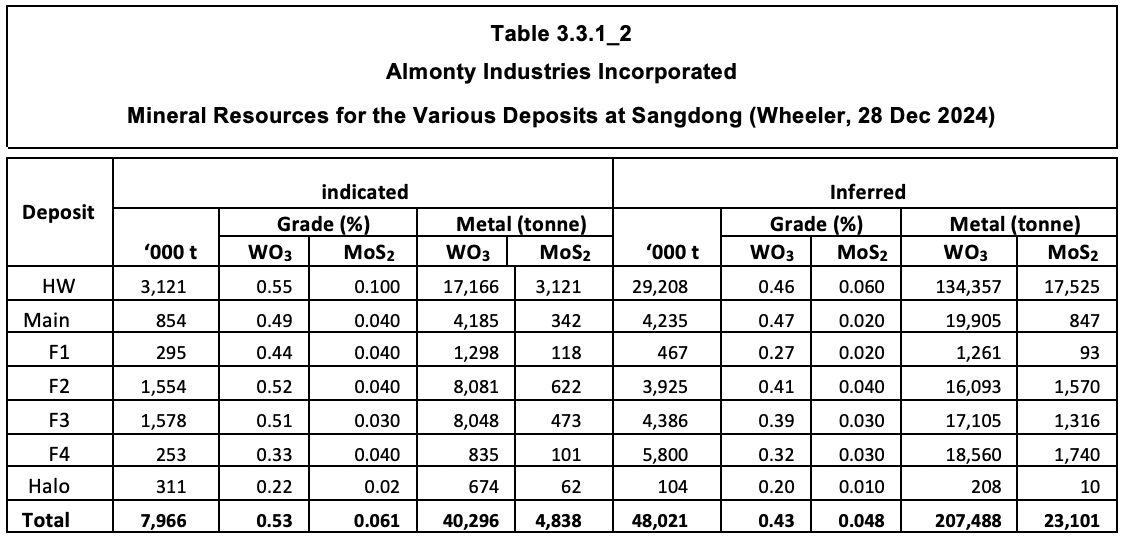
Surprisingly, the table includes numbers for molybdenum, which comprise substantial amounts for Inferred Resources. The discussion on MRE methodology essentially ignored molybdenum.
The table indicates that the HW zone constitutes the largest resource, accounting for more than 43% of the tungsten contained in Indicated Resources. The Main zone accounts for less than 11%. The reason behind this is the focus of historical mining on the Main zone, as shown in Figure 3.1.1_1.
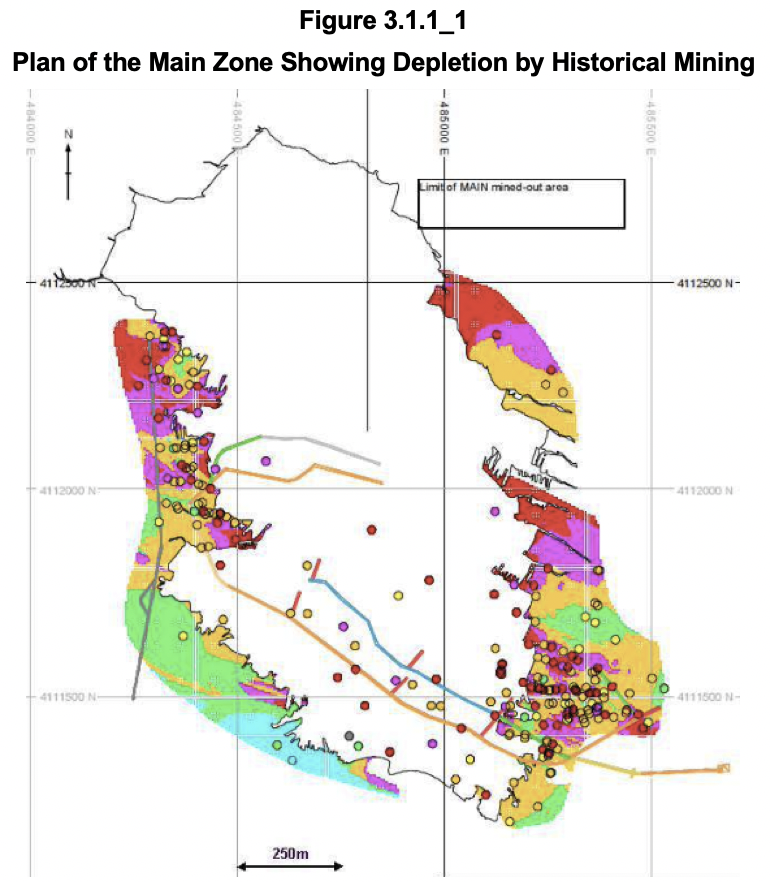
The colours warmer than green indicate a grade in excess of 0.2% WO3.
The technical report includes in Appendix C a total of 14 NE-SW cross-sections that give a good insight into the width, attitude, and number of boreholes used to interpret the individual zones. It goes beyond the scope of this report to repeat all of these, and Crux Investor has chosen sections 6 and 7, which are approximately central to the modelled region, as examples to reproduce in Figure 3.1.1_2.
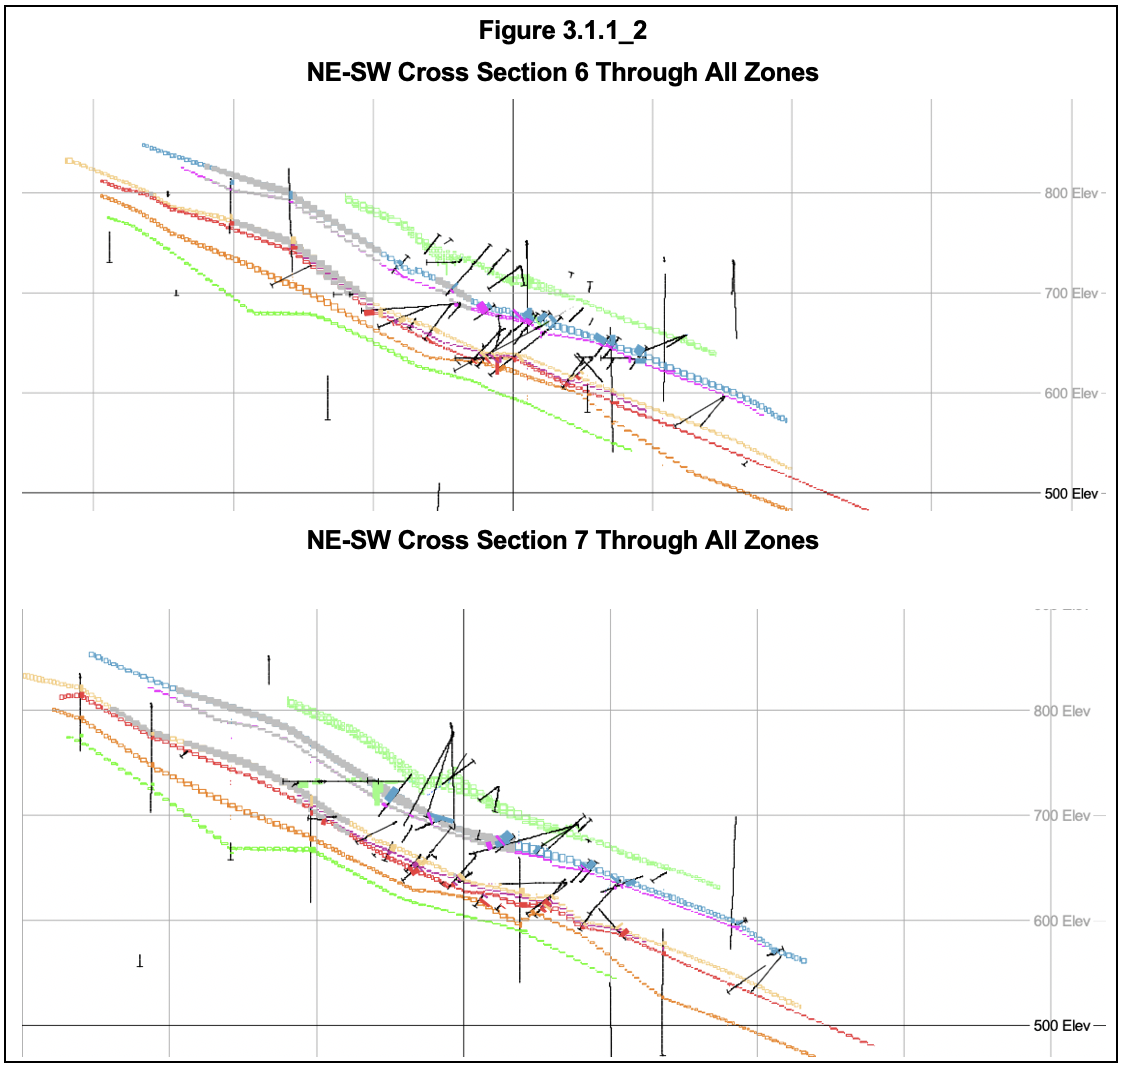
Note that the blue outline is for the Main Zone, the light orange outline for the F2 Zone and the red outline for the F3 Zone. Also note that the grey colour indicates the mined-out area. The scarcity of intersections through the green outline for the HW Zone beyond the central portion is of concern. As the HW zone comprises the majority of estimated mineral resources, one has to wonder how far beyond drill hole intersections the zone has been extrapolated. This is extra concerning given the inconsistent nature of mineralisation in the HW zone.
The HW zone has been mined to a minor degree, as is shown in Figure 3.1.1_3.
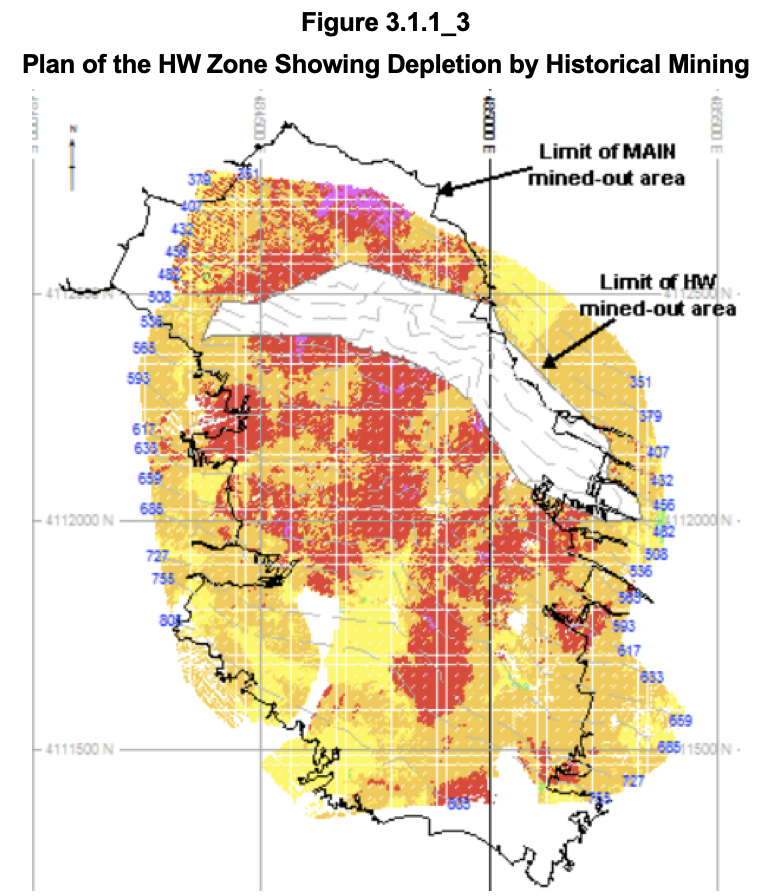
The same colour coding for grade as in Figure 3.1.1_1 applies to the Main Zone. Given the preponderance of orange (>0.3% WO3) and red (>0.8% WO3), the declared average grade for HW of 0.55% WO3 seems low compared to the declared grade of 0.49% WO3 for the Main Zone. However, the technical report does not include a map showing the areas classified as Indicated & Inferred resources, contrary to the Main Zone.
Besides the less-than-impressive intersection density, Crux Investor has major concerns about the MRE. These include:
- Nowhere is it explained how the true widths of the HW intersections in Table 3.2_1, with a weighted average of 3.64 m, reconcile with the much wider intervals reported in Table 3.3.1_2, averaging 17.4 m. Even if the 2012-2014 drilling is not totally representative, the difference is too large to remain unexplained.
- The technical report does not give the logic behind the different approach to estimating HW resources. Why could no wireframes be generated within this domain using a threshold of >0.15% WO3 grades?
- If the HW resources compare so well in terms of grade and thickness with the Main Zone, why was the Main Zone the focus of historical mining?
- A MRE by AMC Consultants Pty Ltd (“AMC”) dated February 2015 arrived at very different numbers with Measured & Indicated resources of 3.8 Mt at 0.56% WO3, which gives a metal content of 53% the current MRE. The 2025 technical report provides a number of reasons for rejecting AMC’s MRE, but it does indicate that different approaches can result in very different results. Moreover, the cut-off grade of 0.40% WO3 by AMC is much higher, but it hardly affected the average grade compared to the 2024 MRE grade. It shows that individual mineralised zones are dominantly determined by geological boundaries and not grade thresholds.
- The geological description pointed out that the central portion of the Main Zone has the highest tungsten grade. The current MRE has included the assays of this area in its workings, which may have given a positive bias. The central area has a diameter of 350 m, and Figure 3.1.1_1 shows that mining has progressed well beyond this diameter. In the opinion of Crux Investor, the data of the mined-out area should have been excluded from the exercise.
Mineral Reserves
The mineral reserves assume that the Main/F1 zones will be mined together, given their proximity.
The estimation of mineral reserves assumed employment of two mining methods: Stepped Drift-and-Fill (“SDAF”) for the Main/F1 and F2, Halo and F3 horizons, which are generally narrower than 6 m, and Post Pillar Cut-and-Fill (“PP-CAF”) applied in al HW zone areas as these are supposedly more than 5 m thick.
Table 15-4 of the technical report gives the SDAF method dilution of 24% and a mining recovery of 97%, whereas PP-CAF dilution is forecast to be less than 4% and an overall mining recovery of 85%.
Table 3.3.2_1 gives the Mineral Reserve statement, effective 28 February 2025.
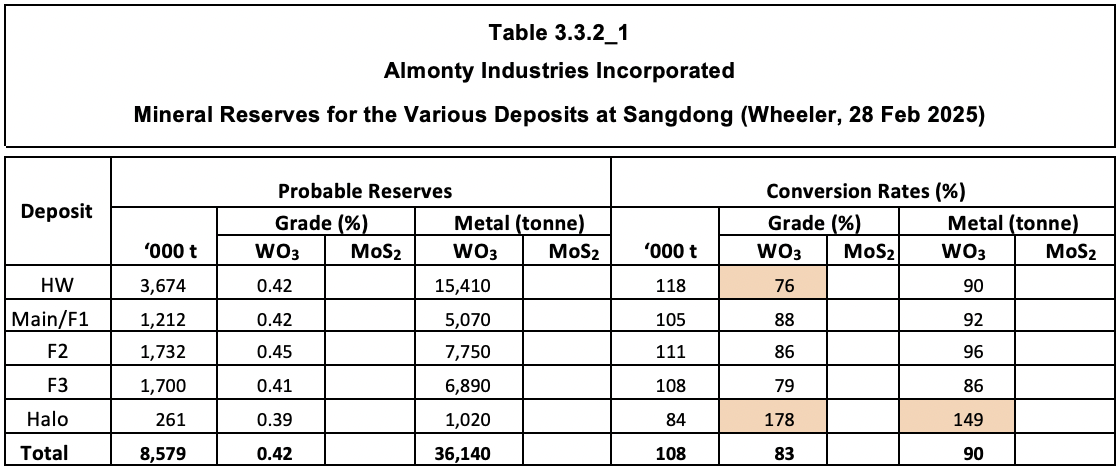
The mineral reserve statement acknowledges the lack of substantiation for molybdenum figures in the mineral resources, which ignores the metal.
The table illustrates that 90% of the WO3 contained in mineral resources is converted to reserves at a grade that is 17% lower. However, the details for individual zones indicate that the drop in grade is 24% for the HW zone, which is inconsistent with the details in Table 15-4. Moreover, the conversion rates for Halo do not make sense at all, with almost 50% more WO3 metal in reserves than in resources.
Mining Operations
Introduction
Extensive mining has taken place within the Sangdong Mine property. At the time of its closure, the mine had been developed on more than 20 levels, between the elevations of 242 and 755 metres above mean sea level (“masl”), with a total length of 20 km. The mine is located on a mountainside, and portals have been developed at the various levels, with two old and one new entry portal situated on the main Sangdong level.
Rock mechanical conditions based on the Q-system all pointed to “poor” and “fair” categories. This has implications for support and maximum span widths for working areas, which will have to be relatively limited. Small-sized development would require systematic bolting and jumbo development would require systematic bolting and mesh.
The selected mining methods take account of the rock conditions by having relatively limited span sizes.
Stepped Drift and Fill (“SDAF”)
In the stepped drift-and-fill method, single drift-and-fill headings will be extended along strike, close to horizontal, with inclined shanty backs to reduce dilution at the hanging wall contact. SDAF headings will be developed with a width from 3 m to 6 m. The panel lifts will be stepped up in approximately 2 m vertical intervals, corresponding with the average 22-degree dip of the F2, F3 and Main beds. Figure 3.4.2_1 shows the DAF stope panels in cross section.
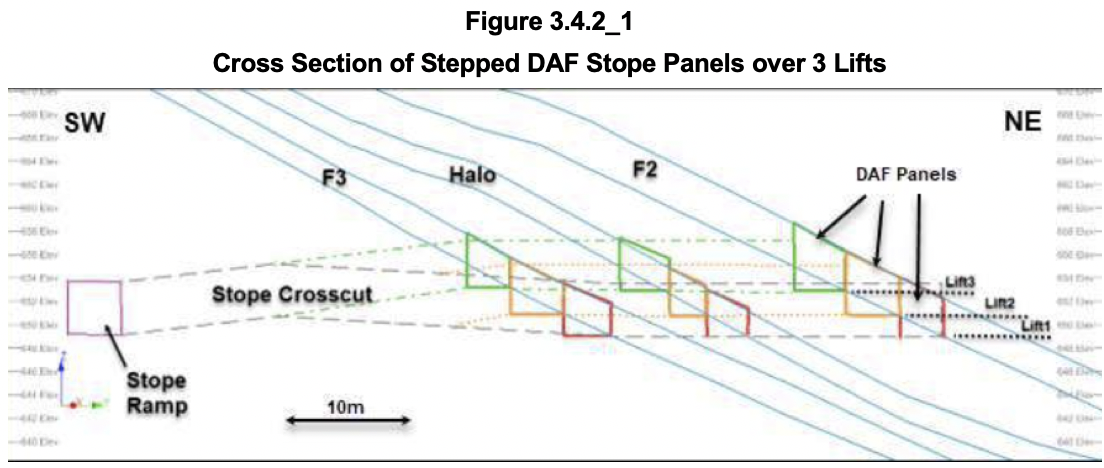
The stope drives will need to be of a variable width, from 3 m to 6 m, to have the floor of the next (higher) stope drive located approximately 2 m higher. As is evident from Table 3.3.1_1, the dips can vary much around the average design angle of 22 degrees. This is why the variable width of the stope drives is to have the floor of the next (higher) stope drive located approximately 2 m higher. The technical report does not explain how the reported cross-cutting faults with off sets of 1 – 4 m will be handled.
The cross-section also shows that the method will use external stope ramps on the footwall side of the ore zones, approximately 20 m below the bottom bed. Due to the low orebody dip this means at any particular elevation, the ramp will be approximately 70 m horizontally to the south of the F3 bed. Three lifts can be served from one cross-cut with in-stope ramps that access the lift above. After three lifts, a dedicated new ramp is developed 35 m along strike of the original ramp.
Mined stope drives will need to be backfilled with paste fill. Adding 1% cement to the past is planned for backfilling old stopes, 3.5% for active stopes and 7% for undercut stopes.
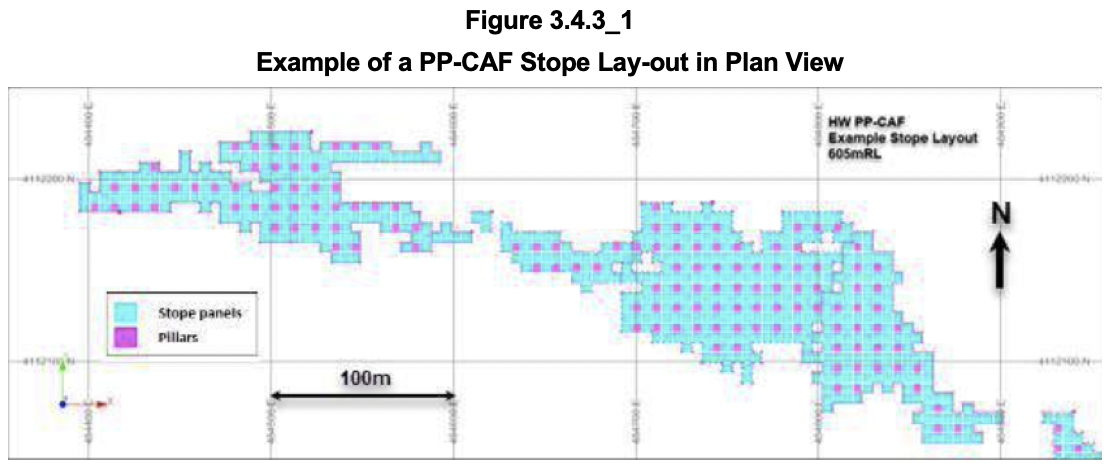
Post Pillar Cut and Fill (“PP-CAF”)
This method has been designed for those areas which generally have a vertical thickness greater than 5 m, which is the majority of the HW zone. Although the HW zone is well-mineralised, there are erratic patches on internal waste. Pillars will preferably be sited where such waste occurs. The schematic plan in Figure 3.4.3_1 shows how pillars are dominantly at the stope’s outer boundaries.
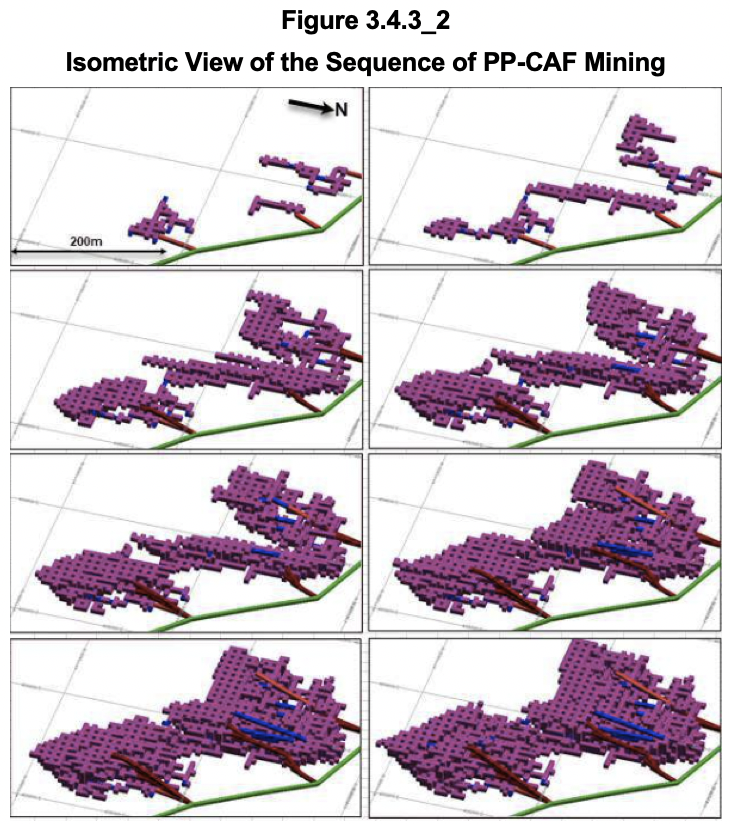
Access to each stope will be via inclined ramps generally going down from the level galleries in the hanging wall. These ramps will allow access to each stope block’s lower-most 6 m lift. Once all the PP-CAF panels have been mined and backfilled for an entire lift, the stope ramp access is then raised so as to provide access to the next 6 m lift above. This sequence can then be repeated lift-by-lift. Generally, 3 m to 6 m lifts can be accessed from the same original level crosscut access. The technical report then gives an isometric illustration of how this would work, reproduced in Figure 3.4.3_2.
It looks impressive, but it does not give a proper insight into how it works in cross-section. For this, reference had to be made to the previously suggested mining sequence of the HW zone. Figure 3.4.3_3 is much clearer on this.
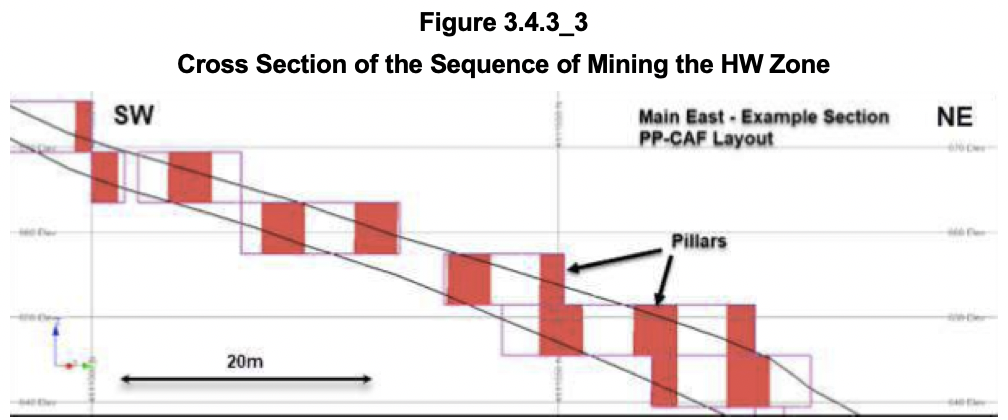
The above illustration shows the HW Zone as having a true width of 3.6 m when using the bar scale. It all looks a lot less impressive and less efficient in terms of mining recovery and dilution prevention. What about the 6 m lifts? Crux Investor admits it cannot make head nor tail of what is suggested.
Metallurgy and Processing Operations
Metallurgical Test Work
The discussion of metallurgical testwork goes back to findings in 1954, with findings of the 2010 scoping study work in 2010, testing in 2012, and from 2016 onwards and work during 2020 to 2022. Strangely, the actual metallurgical performance on processing between 1960 and 1992 is not provided as a reality check. This period covers production starting with treating a plant feed at a grade of 1.21% WO3, dropping to 0.53% WO3 upon closure. Actual performance over this period would give a good insight into what can be expected.
Based on locked cycle and pilot plant tests, “an overall global mill recovery of 85%, along with a concentrate grade of 65% WO3” is suggested. Crux Investor will work with these numbers.
Processing
Run-of-mine (“ROM”) ore will be either directly fed into the primary crushing system or placed onto a blending stockpile, aimed at a consistent feed quality. The blended ore, nominally sized at minus 400 mm, will undergo primary crushing through a jaw crusher, producing a product with a nominal size of 80% passing (“P80”) minus 100 mm. Crushed ore will be transported via conveyor systems to a covered coarse ore stockpile, which is fed to a two-stage grinding circuit consisting of a semi-autogenous grinding (“SAG”) mill and ball mills. The particle size target will be a P80 of minus 65 microns.
The ground material is first sent to a sulphide flotation circuit consisting of a rougher stage followed by two cleaner stages designed to remove sulphide minerals. The concentrate will be disposed of, and the tailings will be treated in a scheelite rougher flotation circuit. The concentrate is sent to the cleaner circuit, and the tailings to scavenger flotation cells for further recovery. Scavenger tailings are considered final tailings. The scheelite cleaning circuit provides a multi-stage flotation process for the final upgrading of scheelite concentrates derived from rougher and scavenger flotation stages. This circuit comprises four sequential cleaning stages.
Tailings are thickened, and the underflow is sent to the paste plant.
Economic Valuation
Metal Prices Used and Scenarios Analysed
Crux Investor has analysed one scenario in which it adopted all the inputs in the technical report to verify that its model is consistent with the Almonty model and to determine whether its tax calculation arrives at the same number. The 2025 technical report assumes a tungsten price of US$450/MTU APT with a discount of 22% to arrive at the MTU price in concentrate.
The technical report includes the graph reproduced in Figure 3.6.1_1 for the price history of APT since 2012. To place this into context, Crux Investor has annotated the graph by adding a green dot for the price during the last two years of operation (i.e. 1991-1992) as provided by http://www.refractorymetal.biz/nd.jsp?id=4 corrected for inflation to express it in 2018 terms. Since 2018, the US CPI index has risen by 30%, which would make the tungsten price in 1991-1992 approximately US$227 in today’s money terms.
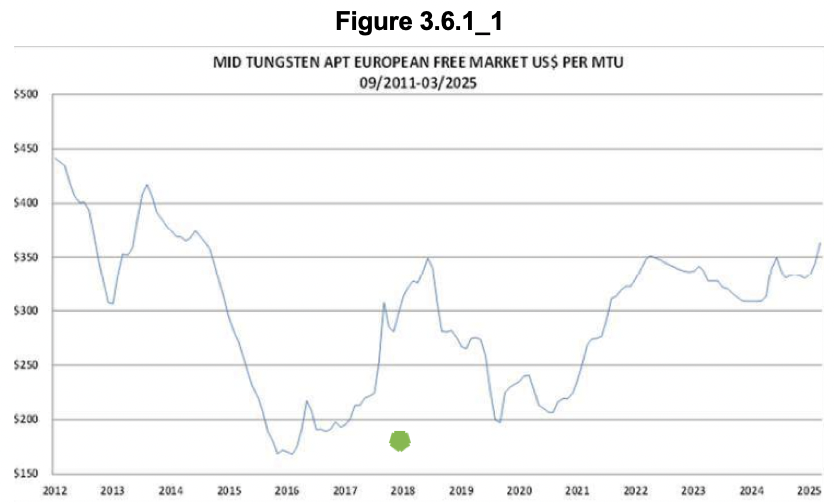
In the last two years of Sangdong production, the feed grade was 0.53% WO3, or 26% higher than the current reserve grade. Applying this to the US$227 would make this US$285/MTU for 1991-1992, adjusted for grade. Considering that mining was unsustainable at that price, one would expect the operation to need a long-term price well above the current US$407/MTU.
The other scenario, the Crux Investor Case, uses an APT price of US$500/MTU in recognition of the rapidly improving tungsten price. The same discount of 22% is used to convert to the concentrate price.
Production Schedule
Crux Investor has adopted the production schedules in the technical report as presented in its Table 16-8. Figure 3.6.2_1 shows processed tonnage and the feed grade over the LOM.
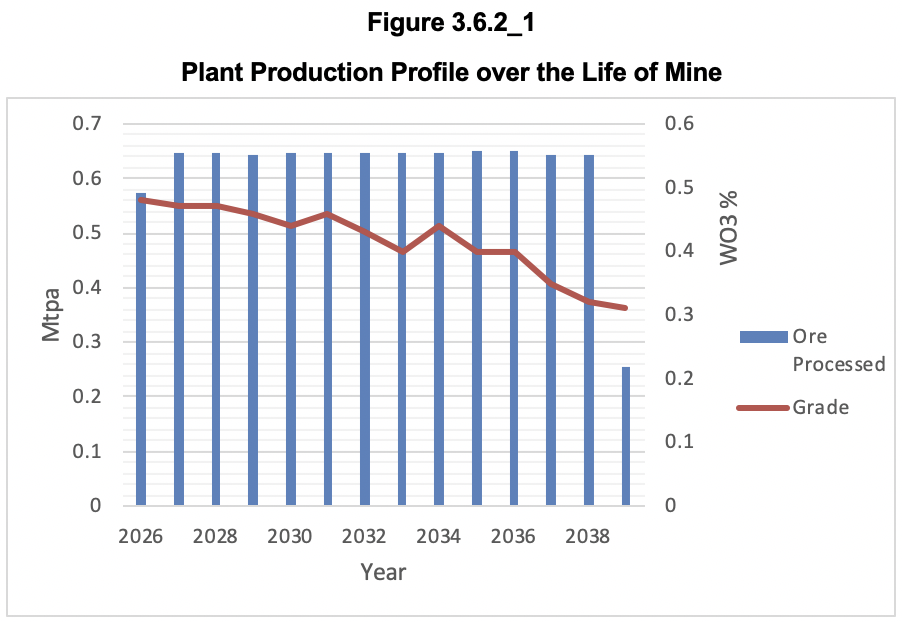
After a one-year ramp-up, assumed to occur during 2026, the plant reaches steady state throughput of 0.65 Mtpa for 12 years and will close down in year 14, which would be in 2039. The plan is to feed higher grades in the earlier years.
Capital Expenditure
With the mine and plant substantially developed and constructed, little capital expenditure remains before the start of production in 2025. Table 3.6.3_1 shows that only US$16.1 million is required in 2025 to complete the initial capital expenditure.
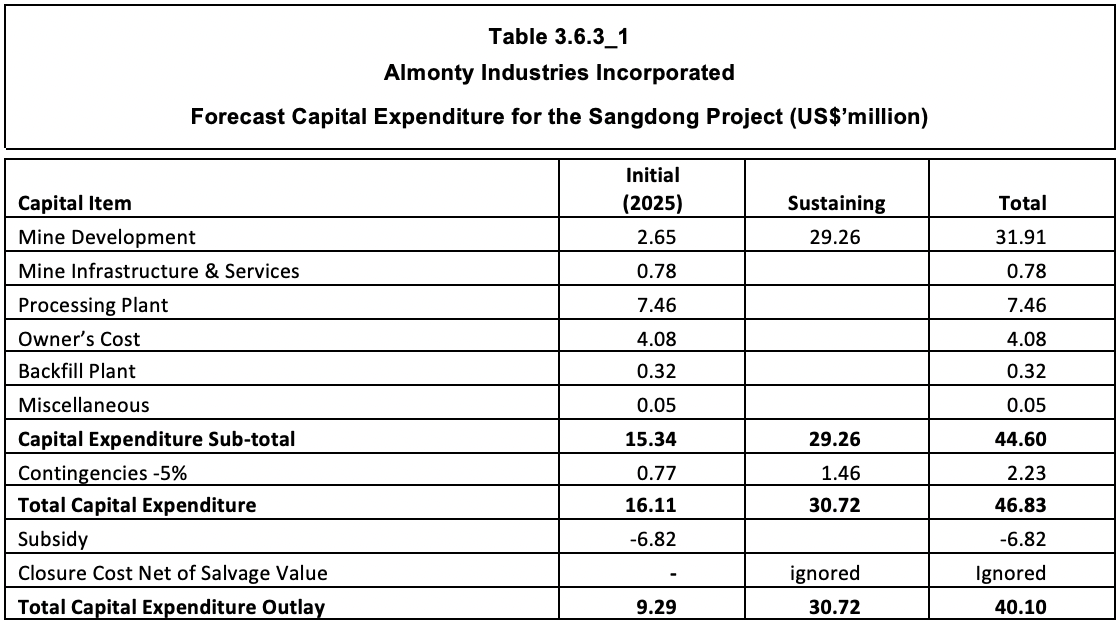
A contingency of 5% is very low, even with an EPC contract. Crux Investor records that the quarterly statement for the period ending 30 June 2025 shows “additions to mining assets” for the year to date of C$14.9 million. The company does not detail where this expenditure was incurred, but it is unlikely that much was spent elsewhere than Sangdong. A capital expenditure overrun can be expected.
The sustaining capital expenditure on mine development seems very low, but there is much existing underground development which could explain the low provision.
The MDA for the period ending 30 June 2025 indicates a restoration provision balance of C$3.2 million related to Sangdong.
Operating Expenditure
Table 3.6.4_1 presents the estimated operating cost as per the 2025 technical report. It also includes the provision used by Crux Investor for its scenario.
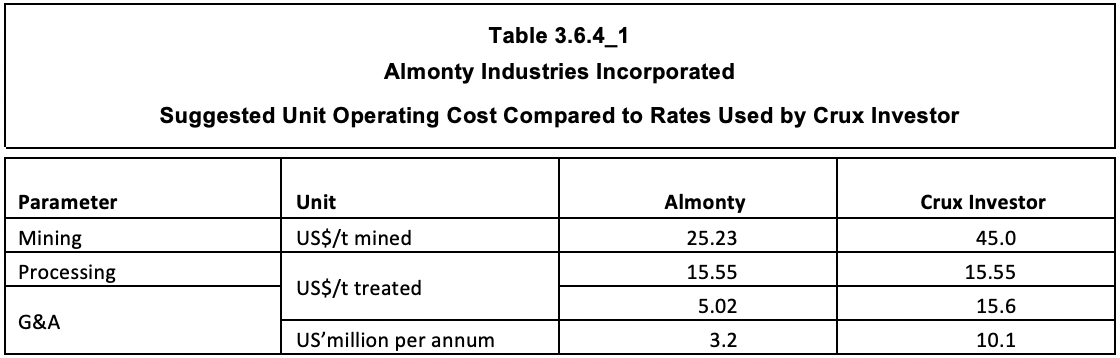
Whereas the processing cost provision looks thin considering the relatively fine size of grinding, the complexity of the plant and its small scale will give poor economies of scale, Crux Investor has given it the benefit of the doubt and accepted it for its valuation.
However, the suggested cost rate for mining is something one would expect for a very large-scale bulk mining operation such as one employing the vertical crater retreat method. Mining at Sangdong will have to cope with poor ground conditions, forcing the employment of relatively low-productive mining methods and many ground support measures. At a production rate of less than 0.65 Mtpa this will be a small operation lacking economies of scale. Crux Investor has used US$45/t mined, which is probably still far too low.
The G&A cost rate suggested by Almonty converts to an annual rate of just over US$3 million. In the opinion of Crux Investor, even the smallest formal mining operations will need to spend US$10 million per annum to cover such costs, including marketing, legal, environmental monitoring, security, and training services. Accordingly, it has increased the unit rate to arrive at US$10 million per annum.
Royalties and Taxes
According to the technical report no royalties are payable, but there is a revenue tax of 0.5% payable. A corporate income tax of 21% is applicable along with a local income tax of 2.1% for a total rate of 23.1%.
The report is not clear about how pre-production capital expenditure is amortised and sustaining capital expenditure is depreciated for tax purposes.
Price Waterhouse Cooper (“PWC”) indicates under https://taxsummaries.pwc.com/republic-of-korea/corporate/deductions that straight-line depreciation is usually applied at 20% per annum on vehicles and equipment, and much longer for buildings. Crux Investor has assumed that, on average, 20% would apply to mining assets.
The technical report mentions that a US$15.34 million capital expenditure was incurred prior to production. A tax loss of US$4 million is available, with another US$3 million expected during the 2025 fiscal year. However, when referring to the cash flow statement in the technical report, capital expenditure of US$75.2 million was incurred before year 1 (=supposedly 2025). Crux Investor has included this amount for amortisation in addition to expenditure in 2025.
Moreover, the 2024 financial statements give under note 11 an amount of C$33.0 as “non-capital losses” for Korea. Crux Investor has also used this to offset future taxes.
Results
Table 3.6.6_1 summarises the LOM results for the Almonty and Crux Investor cases.

Using the Almonty inputs, Crux Investor arrives at an after-tax cash flow in Korea that is US$20.3 million higher, which is mostly explained by taxation that is US$22.8 million lower by accounting for non-capital losses available against taxes. Given the close correlation between the results, Crux Investor concludes it has not overlooked anything. Using the technical report inputs, the gross profit margin is 63% which is excellent. However, this only applies because of the low operating cost of US$45.8/t assumed. The technical report arrives at an NPV8 of US$283 million compared to Crux Investor’s US$296 million.
When using the operating cost suggested as more realistic by Crux Investor and accounting for corporate expenses, the cash flow attributable to shareholders drops, despite a tungsten price that is more than 11% higher. The gross profit drops to 44.6% which is respectable, but not impressive. The NPV8 drops by more than 40% to US$174 million.
Table 3.6.6_2 expresses the sensitivity of the project's value as the change in NPV per percentage point change in the main parameters: metal prices, operating expenditures, and capital expenditures.
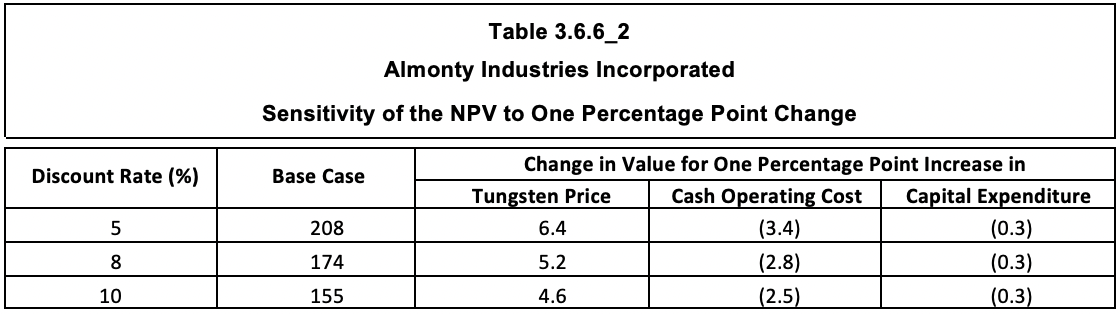
The sensitivity analysis demonstrates the relatively robust nature of the Sangdong project. The NPV8 increases by 3.0% (US$5.2 million) for every percentage point increase in the tungsten price and drops by only 1.6% (US$2.8 million) for every percentage point increase in operating cost (i.e. US$0.77/t processed). Given the very small size of capital expenditure required, the NPV8 is unsensitive to changes in this parameter, changing by 0.3% for every percentage point increase.
The Enterprise Value of Almonty Industries on 21 August 2025
At the share price of C$5.92 on 21 August 2025, the market capitalisation for the 215.86 million shares is C$1.28 billion, or US$920 million.
On 30 June 2025, the company had 10.1 million warrants, 7.7 million CDI options, and 15.9 million stock options outstanding, all of which were in the money. Another 3.4 million restricted share units were outstanding, with an exercise price of C$1.63.
On 30 June 2025, the net current assets amounted to minus C$13.1 million. Subsequent to 30 June, a private placement of 20.0 million shares raised US$90 million.
Based on the above, an Enterprise Value on a diluted basis for Almonty is derived as C$1,505 million (US$1,090 million), as shown in Table 4_1.
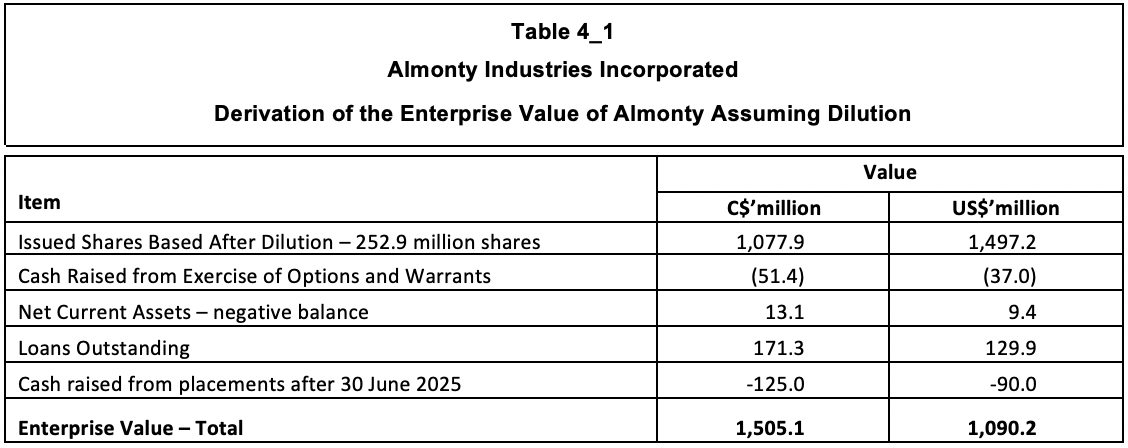
The diluted Enterprise Value is more than 6 times the NPV8 value of US$174 million calculated by Crux Investor.
Another metric to put the Enterprise Value in perspective is to express it as a multiple of the LOM revenue, which is 0.92. From the sensitivity analysis, it is clear that the average tungsten price over the LOM needs to be 175% higher to support the current Enterprise Value. This is not going to happen.
Executive Summary
Almonty Industries Incorporated (“Almonty”) (TSX:AII)(ASX:AII)(OTCQX:ALMTF)(Frankfurt:ALI.F) is a Canadian company that is focused on developing tungsten projects in “conflict-free countries”. It particularly emphasises that it can “fill the supply gap after China, which currently produces 80%+ of global tungsten, restricted exports and recently announced U.S. defense bans on tungsten imports set to begin in 2027”. This resonates well lately.
The company has been around since 2011 and has been producing since 2013. However, its performance has been very lacklustre, and Almonty was forced to close two operations and scale down production since 2018 at another mine called Panasqueira, located in Portugal. Currently, it generates only US$30 million in revenue on an annual basis, and this is without generating positive cash flow. Cumulatively until 30 June 2025 Almonty has been cash negative to the tune of C$210 million, which it covered by raising C$233 million, of which C$65 million was accounted for by equity placements. The cash balance increased by almost C$24 million from 2013 until 30 June 2025. Not much can therefore be expected from its current operations.
Almonty has, however, a project in South Korea, the Sangdong mine, which closed in 1992, but according to Almonty, is one of the world’s largest and highest-grade tungsten deposits. Below this deposit, molybdenum mineralisation is present, but it was never drilled out properly, and no mineral resources have ever been defined. The company’s actions since December 2024 have been to play heavily on the US sentiment to become less dependent on supplies from China. To this end, it has decided to reshape itself as a US-based company. This will allow it to present itself as the “only US-based tungsten provider”. It has played well with the market, and its share price has skyrocketed since December 2024, reaching C$5.92 by 21 August 2025. This attracted the attention of Crux Investor and is the reason for the review and valuation. As the company’s share performance seems to be determined by the development and imminent completion of the refurbishment of the Sangdong mine, this report has ignored the other projects and focused on Sangdong.
A technical report dated June 2025 is the main source of information about the plans for future mining. The company has indicated it wishes to expand production after start-up, but that is still not certain and is unlikely, as will be explained below.
The technical report was drafted by a single person, which has the disadvantage that this person cannot be an expert on all aspects of a mine project and misses the support of a peer reviewer. A peer review could have identified information gaps and inconsistencies. Crux Investor has found it very difficult to comprehend what is presented in the technical report at times and has encountered numerous discrepancies.
The tungsten mineralisation at Sangdong is contained in several tabular zones that dip at a very moderate angle slightly east of north. These zones have been called from top to bottom the Hanging Wall (“HW Zone”), Main and Footwall horizons. The Footwall zone comprises multiple layers, the most important of which are F1, F2 and F3. F1 occurs 1 m below the Main horizon and is approximately 2 m thick. Historical production has predominantly been derived from the Main zone and the F1, F2 and F3 zones. The HW zone has been mined to a minor extent. The HW zone is, however, now the main deposit for mineral resources.
Crux Investor has some major reservations about how the mineral resource estimation (“MRE”) has been conducted using different approaches for the HW zone and all other zones. Nowhere is it explained why the different approaches are warranted. One of the probable reasons is that mineralistion within the HW Zone is inconsistent and does not allow for neat wireframing as in the other zones. Review of cross sections show that the HW Zone has been drilled poorly compared to the other zones. The fact that this zone was mined to only a minor extent should also be a reason for caution.
The mineral reserves are defined based on two mining methods that account for the poor ground conditions at Sangdong. One of the methods is for the HW Zone, and the other is for all other zones. The HW zone will be mined with little dilution (= waste mined with ore), but a mining recovery (proportion of resource mined) of 85%, whereas mining the other zones will have a very high extraction rate, but with 24% dilution. Overall, 90% of the tungsten contained in mineral resources is forecast to be mined at an average grade that is 83% lower than the resource grade. Crux Investor records that the mineral reserve statement makes no sense as, not for the other zones, but the grade from HW mining is 24% lower than for its resources. Moreover, one particular zone suddenly yields almost 50% more metal than in its mineral resources.
Crux Investor has adopted the metallurgical performance as suggested in the technical report, but notes that no historical processing performance is provided as a reality check.
Two scenarios have been modelled: the Almonty case, and the Crux Investor case. Modelling the Almonty case serves as a check that there have been no oversights and to see whether or not the calculated taxes are close. In fact, it was found that the two models correlate well, except that Crux Investor has lower taxes by including C$33 million “non-capital losses” as per the 2024 annual financial statements.
The Crux Investor case further differs from the Almonty case by assuming a tungsten price that is 11% higher, but also assuming much higher mining and general and administration (“G&A”) costs and accounting for corporate expenses. The mining cost rate of US$25.2/t suggested by Almonty is not credible for the poor rock conditions, the suggested mining methods and poor economies of scale. The same applies to the suggested G&A, which would amount to only US$3.2 million per annum. Crux investor has used the mining cost of US$45/t, which is probably still far too low, and G&A of US$10 million per annum.
The two cases arrive at NPV8’s of US$296 million for the Almonty case and US$174 million for Crux Investor case. Both values are much lower than the diluted Enterprise Value of US$1,090 million on 21 August 2025. It means that, even according to Almonty, the value of the project is much lower than the market now reflects. In fact, the life of mine (“LOM”) revenue only slightly exceeds the Enterprise Value. Sensitivity analysis shows that the tungsten price needs to be 175% higher than the modelled price.
And prospects for expansion? Not credible at all. Firstly, mineral resources will have to be defined far from where current drilling information is available. Secondly, mining has focused on the central portion above the intrusion responsible for the mineralisation. As the zones are followed outwards, the grade drops. This is why historical production started at a grade of 1.21% WO3 and dropped to 0.53% upon mine closure. Finally, the narrow zones and poor ground conditions do not lend themselves to producing at a high rate.
Crux Investor, therefore, concludes that the market has been caught up in the hype and Almonty is vastly overvalued.
Introduction
Almonty Industries Incorporated (“Almonty”) (TSX:AII)(ASX:AII)(OTCQX:ALMTF)(Frankfurt:ALI.F) is a Canadian company focused on tungsten projects.
The company was incorporated in September 2009 and made its qualifying transaction for listing on the TSX in 2011. The transaction involved the acquisition of the company that owned the Los Santos mine in Spain and an option to purchase the Valtreixal tungsten project in Spain (exercised in December 2016). This transaction was followed in 2014 by the acquisition of Wolfram Camp Mine in Queensland, Australia. Continuing with its strategy of acquiring tungsten projects, Almonty entered a phase during which it purchased other such assets on an annual basis: in 2015, the Sangdong mine in South Korea and in 2016, the Panasquiera mine in Portugal. As of January 2016, the company had three operating mines and one closed-down mine, Sangdong, which it intended to return to production.
However, matters soon took a turn for the worse. Crux Investor has graphed in Figure 1_1 the financial performance since the first financial year ending September 2013 for which annual statements are available. The 2025 numbers have been annualised.
As shown above, in 2019, the year-end changed to 31 December.
The above graph shows the company has been almost consistently cash negative after accounting for investments.
Cumulatively, until 30 June 2025, it was cash negative to the tune of C$210 million, which it covered by raising C$233 million, of which C$65 million was accounted for by equity placements. The cash balance increased by almost C$24 million.
The graph also shows the average tungsten price for each period as reported by Almonty. The price is expressed in metric tonne unit (“MTU”) tungsten in the form of ammonium paratungstate (“APT”). Tungsten concentrate is typically priced at a discount to the price of APT, with concentrate vendors receiving about 70-80% of the APT price. This discount reflects the cost and effort required to refine tungsten concentrate into APT.
Almonty’s timing of acquisitions was unfortunate. The APT price collapsed in 2016, but it has been recovering since.
The consequence of the price collapse was the closure of the Wolfram Camp Mine in 2016 financial year, and of Los Santos in the 2018 financial year. Almonty decided in 2018 to cease expenditure on the refurbishment of the Wolfram Camp mine altogether and to place its holding companies in voluntary liquidation. It meant that in the 2019 financial year the company had only one operating mine, Panasquiera, for which it did not provide operating statistics in its Management Discussion and Analysis (“MDA”) reports as from the 2018 financial year. However, because revenue dropped dramatically after 2018, it is evident that the mine contributed only C$20 million per annum despite the increase in APT prices. Cash from operations net of investments saw a precipitous drop reaching a negative C$58 million in 2024 and negative C$87 million for H1 2025 annualised. Whereas cash was negative on an operational level, investments at Sangdong were responsible for most of the cash outflow.
In light of the above, the skyrocketing share price since December 2024, as shown in Figure 1_2, is intriguing:
The sudden price explosion has attracted Crux Investor to look deeper into the company’s prospects.
Developments Since December 2024
Compared to the 2022 – 2024 period, the spot price is not much higher, trading at an average of US337/t MTU APT during the March 2025 quarter. In other words, the share price rise has been dominantly influenced by other factors other than the spot tungsten price.
A review of the press releases since late 2024 shows the following main events have occurred:
- On 21 November 2024, it was announced that the grinding circuits for the Sangdong processing plant had arrived. The market could now see that progress was finally made at erecting and completing this plant. Progress has been unexplainably slow at Sangdong. As far back as March 2018, the company had entered into a “new off-take agreement with an existing customer”. In January 2020, the company had received “a binding commitment letter from the KfW-IPEX Bank for the proposed project financing for the development and operation of the Company’s Sangdong Mine”. The MDA report for the year ending 31 December 2020 also advised that “Almonty had entered into an engineering, procurement and construction (“EPC”) contract with S – Material Hanlding Co Ltd for the development work at the Sangdong Mine”. The MDA for 2022 includes the statement that “Meanwhile, work is continuing at the Sangdong site to ensure timely commissioning as requested by Almonty’s customer”. Note that the term commissioning implies advanced development and construction. The MDA report for the quarter ending 30 June 2025 finally indicates that “the Sangdong Mine is fully permitted, and the Company expects construction at the Sangdong Mine in the second half of 2025.” It seems that the much-delayed planned production will finally end with imminent production starting in the coming months. This will definitely have comforted the market. The MDA reports do not explain precisely what is behind all the delays.
- In January 2025, Almonty announced that it had entered into an offtake agreement with the largest processor of molybdenum products in South Korea for 100% of the material produced. Production is expected by the end of 2026. It has not been explained how this will be accomplished without the company having established its molybdenum mineral reserves at Sangdong.
- In February 2025, Almonty received approval for domestication in the USA, positioning Almonty to become the only U.S.-based company producing tungsten concentrates at a commercial scale.
- In March 2025, Almonty entered into a strategic partnership agreement with American Defence International Inc. (“ADI”), a government relations and business development firm based in Washington, D.C.
- In May 2025, Almonty announces the execution of a binding Offtake Agreement with Tungsten Parts Wyoming, Inc. (“TPW”), a U.S.-based defense contractor, and Metal Tech (“MT”), a tungsten processor based in Israel.
- In June, the company announced that Alan Estevez would be appointed to its Board of Directors effective 30 May 2025. Mr. Estevez is a “nationally recognised authority in national security, defense logistics, and strategic trade.”
- Also, in June, the company announced receipt of a formal letter from the Chairman and Ranking Member of the U.S. House Select Committee on the Strategic Competition Between the United States and the Chinese Communist Party. Almonty states, “The letter underscores Almonty’s strategic importance to the United States as it seeks to secure critical mineral supply chains amid rising geopolitical tensions”.
- In July, there was an announcement that Almonty had filed an “updated” technical report for the Sangdong mine.
The above indicates that the company has been positioning itself to be supported by the US government.
In June, the “updated” MRE technical report was released. This is a misnomer, as the mineral resource statement is unchanged from 2016. The document is almost identical, except for including some additional metallurgical testwork, including a table to substantiate the assumed cut-off grade and a change in suggested mining methods.
From the above, it is evident that developments around Sangdong determine the recent price history. The only other operation, Panasquiera, has been unable to generate positive cash flow and its reserves of 1.95 million tonne (“Mt”) effective 31 September 2016, declared in a technical report dated 31 December 2016 was sufficient for a 3-year LOM at the production rate of 0.6 – 0.7 million tonnes per annum (“Mtpa”) at the time. For the purposes of this valuation, Panasquiera can be ignored as supporting the market capitalisation of C$1.28 billion on 21 August 2025.
The following section will review Sangdong and its capacity to deliver the financial performance necessary to support Almonty's Enterprise Value.
Valuation of the Sangdong Project
Background
The information in Sections 3.1 to 3.6.5 of this report is derived from a NI 43-101 compliant technical report dated 23 June 2025 reporting on the findings of a mineral resource estimation (“MRE”) and authored by a single person, Adam Wheeler, who was also responsible for the 2016 report. Since then, no further drilling has been carried out. Any amendments by Crux Investor will be clearly signalled.
Crux Investor records that Mr Wheeler is a mining engineer. Usually, a specialist resource geologist would sign off on the mineral resources. Moreover, having a single author, no peer reviewer could have pointed out to the author when the explanations were not clear on specific points and corrected internal inconsistencies. Crux Investor has found reviewing the document confusing, unclear and inconsistent in many instances, as demonstrated below.
The deposit is located at Sangdong in the south-eastern Korean Peninsula, about 170 km east-south-east of the capital city of Seoul, 25 km southwest of Taebaek and 55 km south-east of Wonju (see Figure 3.1_1).
The project area is well served by Expressways and paved roads. The 175 km from Seoul can be covered in 3.5 hours. Sangdong is located 5 km south of the Yemi railhead, from which bulk cargo transport can also be arranged. Infrastructure is readily available, with two high-tension power lines crossing the property and a new power line offering 20 MVA capacity.
The project area comprises 12 mining rights covering almost 32 km2. The company was granted a 20-year extension on 13 May 2025. No royalties are applicable, but a 0.5% local resource and facility tax levied on the value of mined material is due to the local government.
Geology and Mineralisation
The tungsten mineralisation at Sangdong is contained in several tabular, bedding conformable “skarns” within a shale unit. Skarns are carbonaceous rocks, such as limestone and dolomite, that are altered by fluids emanating from a crystallising igneous rock to a “calc-silicate rock” with the calcium derived from the original rock and the silica from the mineralising fluids. The Sangdong skarns have been interpreted as carbonate horizons altered and mineralised by hydrothermal fluids ascending from the underlying Sangdong Granite.
The skarn horizons are referred to from top to bottom, the Hanging Wall (“HW Zone”), Main and Footwall horizons. Figure 3.2_1 shows a schematic cross-section of the Sangdong deposit with the relative position of the horizons. The horizons can be seen to be dipping generally around 25 degrees NNE.
Mineralisation is not present over the total width of the horizons, but is primarily associated with swarms of quartz veins within those horizons, except the central portion of the HW horizon. Quartz veins are most abundant within a central, quartz-rich portion of the deposit, parallel to and discordant with the calc-silicate layering. Veining ranges from one to a few tens of centimetres in width and is best developed in the lower portions of the mineralised horizons.
The HW horizon varies in thickness from approximately 5 m to 30 m because of the irregular shale boundary with the overlying limestone. The maximum thickness is over 100 m and occurs near the centre of the deposit. The zone has a strike length of about 600 m and a down-dip extent of about 800 m. The base of the HW horizon is approximately 14 m above the upper contact of the Main horizon. The HW horizon has seen minor historical mining. This is probably due to tungsten mineralisation here being more variable and less clearly concentrated in zones.
The Main horizon strikes about 100° and dips northerly between 15° and 30°. The strike length exceeds 1,300 m, and the thickness varies from 5 m to 6 m. Hydrothermal alteration within the Main horizon forms three concentric, roughly circular zones with the best tungsten grades in the central quartz-rich zone, which has a diameter of 350 m. Surrounding the central zone are respectively a hornblende-rich zone and a diopside-rich zone. Unfortunately, the technical report does not discuss typical tungsten grades for these zones and how they compare to the central zone. There is only a qualitative statement “the abundance of scheelite (= CaWO4) within the mined portion of the Main horizon is concentrically zoned, increasing with alteration intensity, depending on temperature and on the oxidation conditions”.
The Footwall horizons comprise multiple layers, the most important of which are F1, F2 and F3. F1 occurs 1 m below the Main horizon and is approximately 2 m thick. F2 and F3 are approximately 35 m to 40 m below the Main horizon and are typically 3 m to 4 m thick. Further Footwall Zones have been identified below F3 and are collectively called F4 and F5. The lateral dimensions of these horizons and the zonal distribution of calc-silicate minerals are similar to those of the Main horizon. The F1 zone has sometimes been mined with the extraction of the Main Zone. Some parts of F2 and F3 have been mined in the upper section of the mine.
The mineralised zones have been affected by steeply north-dipping reverse and normal faults, which have resulted in offsets of the mineralised horizons by as much as 50 m to 100 m. Within the deposit are areas of smaller faults, typically spaced 50 m apart. The vertical throw of these faults is typically 1-4 m.
Molybdenum and bismuth are concentrically zoned in a similar pattern to tungsten in the Main horizon.
It is difficult to properly understand the extent and consistency of the mineralised veins and lenses from the technical report. For example, it includes the section below with the red outlines supposedly indicating a grade above 0.1% WO3.
Yet that information conflicts with Table 10-3 of the technical report, which Crux Investor reproduces below in Table 3.2_1, summarising the true thicknesses of the intersections and associated grades.
The table indicated that the average true thickness of the HW Zone intersections is just above 3.6 m, for the Main Zone under 3.0 m, for F1 approximately 1.2 m, for F2 approximately 1.9 m and for F3 approximately 1.8 m. How the outlines in Figure 3.2_2 were generated is unclear. It is possible that intersected lengths were smeared to a width within which the grade remains above 0.1% WO3.
Mineral Resources and Mineral Reserves
Mineral Resources
Company geologists interpreted skarn zones based on lithological interpretation for mineral resource estimation and applied a 0.1% WO3 threshold grade.
For the HW zone, the top and bottom contacts of the skarn were modelled. For all other zones, the centre points of the mineralised intersections were used to generate a digital terrain model, and the intersection's width was used to model the zone’s outlines.
Table 3.3.1_1 reproduces the overall dimensions derived for the various zones, suddenly introducing a “HALO” zone not previously discussed. Apparently, it refers to mineralisation surrounding the Footwall Zones 2 and 3.
With the different approach to outlining the HW zone by modelling the skarn outline, the table gives the impression that this is by far the largest resource. However, this is misleading as mineralisation with a grade exceeding 0.1% WO3 is only within certain portions of the skarn. That is why the summary statistics provided for the composite lengths do have information on their true thickness for the various zones, except for the HW Zone. It makes for a confusing picture.
Before compositing assays, top-cut levels were determined for the WO3 and Mo grades in the various zones. The confusion goes further with a composite length of 5 m specified, but applied “as slightly variable”. It gets worse as the technical report also states a minimum composite length of 0.3 m.
The presented semi-variograms for the Main and HW zones look well defined and supported by sample data.
Two block models were generated: for the HW zone, 10 m x 10 m x 10 m, and for all other zones, 10 m x 10 m x the vertical height of the zone, with a minimum thickness of 2 m. For both models, subblocks were generated down to 5 m x 5 m in the XY directions.
For grade estimation, the HW zone needed a different approach from the one used for all other zones, which applied ordinary kriging for vertical thickness and grade accumulations (grade x thickness). For the HW zone, it was required first to flag blocks as either mineralised or waste by flagging composites as waste or mineralised.
For reporting of available mineral resources, mined-out limits were applied, and a 50 m remnant pillar below the surface topography was modelled.
For the reasonable prospect for eventual economic extraction (“RPEEE”) criterion a cut-off grade of 0.15% WO3 was assumed based on a price of US$450/MTU APT (which is high), and a mining cost of US$25.2/t which is very low for underground mining.
According to the author, Table 3.3.1_2 gives the mineral resource statement, effective 28 December 2024. Crux Investor has left out numbers for F5 as irrelevant for the valuation, as these are not converted to mineral reserves.
Surprisingly, the table includes numbers for molybdenum, which comprise substantial amounts for Inferred Resources. The discussion on MRE methodology essentially ignored molybdenum.
The table indicates that the HW zone constitutes the largest resource, accounting for more than 43% of the tungsten contained in Indicated Resources. The Main zone accounts for less than 11%. The reason behind this is the focus of historical mining on the Main zone, as shown in Figure 3.1.1_1.
The colours warmer than green indicate a grade in excess of 0.2% WO3.
The technical report includes in Appendix C a total of 14 NE-SW cross-sections that give a good insight into the width, attitude, and number of boreholes used to interpret the individual zones. It goes beyond the scope of this report to repeat all of these, and Crux Investor has chosen sections 6 and 7, which are approximately central to the modelled region, as examples to reproduce in Figure 3.1.1_2.
Note that the blue outline is for the Main Zone, the light orange outline for the F2 Zone and the red outline for the F3 Zone. Also note that the grey colour indicates the mined-out area. The scarcity of intersections through the green outline for the HW Zone beyond the central portion is of concern. As the HW zone comprises the majority of estimated mineral resources, one has to wonder how far beyond drill hole intersections the zone has been extrapolated. This is extra concerning given the inconsistent nature of mineralisation in the HW zone.
The HW zone has been mined to a minor degree, as is shown in Figure 3.1.1_3.
The same colour coding for grade as in Figure 3.1.1_1 applies to the Main Zone. Given the preponderance of orange (>0.3% WO3) and red (>0.8% WO3), the declared average grade for HW of 0.55% WO3 seems low compared to the declared grade of 0.49% WO3 for the Main Zone. However, the technical report does not include a map showing the areas classified as Indicated & Inferred resources, contrary to the Main Zone.
Besides the less-than-impressive intersection density, Crux Investor has major concerns about the MRE. These include:
- Nowhere is it explained how the true widths of the HW intersections in Table 3.2_1, with a weighted average of 3.64 m, reconcile with the much wider intervals reported in Table 3.3.1_2, averaging 17.4 m. Even if the 2012-2014 drilling is not totally representative, the difference is too large to remain unexplained.
- The technical report does not give the logic behind the different approach to estimating HW resources. Why could no wireframes be generated within this domain using a threshold of >0.15% WO3 grades?
- If the HW resources compare so well in terms of grade and thickness with the Main Zone, why was the Main Zone the focus of historical mining?
- A MRE by AMC Consultants Pty Ltd (“AMC”) dated February 2015 arrived at very different numbers with Measured & Indicated resources of 3.8 Mt at 0.56% WO3, which gives a metal content of 53% the current MRE. The 2025 technical report provides a number of reasons for rejecting AMC’s MRE, but it does indicate that different approaches can result in very different results. Moreover, the cut-off grade of 0.40% WO3 by AMC is much higher, but it hardly affected the average grade compared to the 2024 MRE grade. It shows that individual mineralised zones are dominantly determined by geological boundaries and not grade thresholds.
- The geological description pointed out that the central portion of the Main Zone has the highest tungsten grade. The current MRE has included the assays of this area in its workings, which may have given a positive bias. The central area has a diameter of 350 m, and Figure 3.1.1_1 shows that mining has progressed well beyond this diameter. In the opinion of Crux Investor, the data of the mined-out area should have been excluded from the exercise.
Mineral Reserves
The mineral reserves assume that the Main/F1 zones will be mined together, given their proximity.
The estimation of mineral reserves assumed employment of two mining methods: Stepped Drift-and-Fill (“SDAF”) for the Main/F1 and F2, Halo and F3 horizons, which are generally narrower than 6 m, and Post Pillar Cut-and-Fill (“PP-CAF”) applied in al HW zone areas as these are supposedly more than 5 m thick.
Table 15-4 of the technical report gives the SDAF method dilution of 24% and a mining recovery of 97%, whereas PP-CAF dilution is forecast to be less than 4% and an overall mining recovery of 85%.
Table 3.3.2_1 gives the Mineral Reserve statement, effective 28 February 2025.
The mineral reserve statement acknowledges the lack of substantiation for molybdenum figures in the mineral resources, which ignores the metal.
The table illustrates that 90% of the WO3 contained in mineral resources is converted to reserves at a grade that is 17% lower. However, the details for individual zones indicate that the drop in grade is 24% for the HW zone, which is inconsistent with the details in Table 15-4. Moreover, the conversion rates for Halo do not make sense at all, with almost 50% more WO3 metal in reserves than in resources.
Mining Operations
Introduction
Extensive mining has taken place within the Sangdong Mine property. At the time of its closure, the mine had been developed on more than 20 levels, between the elevations of 242 and 755 metres above mean sea level (“masl”), with a total length of 20 km. The mine is located on a mountainside, and portals have been developed at the various levels, with two old and one new entry portal situated on the main Sangdong level.
Rock mechanical conditions based on the Q-system all pointed to “poor” and “fair” categories. This has implications for support and maximum span widths for working areas, which will have to be relatively limited. Small-sized development would require systematic bolting and jumbo development would require systematic bolting and mesh.
The selected mining methods take account of the rock conditions by having relatively limited span sizes.
Stepped Drift and Fill (“SDAF”)
In the stepped drift-and-fill method, single drift-and-fill headings will be extended along strike, close to horizontal, with inclined shanty backs to reduce dilution at the hanging wall contact. SDAF headings will be developed with a width from 3 m to 6 m. The panel lifts will be stepped up in approximately 2 m vertical intervals, corresponding with the average 22-degree dip of the F2, F3 and Main beds. Figure 3.4.2_1 shows the DAF stope panels in cross section.
The stope drives will need to be of a variable width, from 3 m to 6 m, to have the floor of the next (higher) stope drive located approximately 2 m higher. As is evident from Table 3.3.1_1, the dips can vary much around the average design angle of 22 degrees. This is why the variable width of the stope drives is to have the floor of the next (higher) stope drive located approximately 2 m higher. The technical report does not explain how the reported cross-cutting faults with off sets of 1 – 4 m will be handled.
The cross-section also shows that the method will use external stope ramps on the footwall side of the ore zones, approximately 20 m below the bottom bed. Due to the low orebody dip this means at any particular elevation, the ramp will be approximately 70 m horizontally to the south of the F3 bed. Three lifts can be served from one cross-cut with in-stope ramps that access the lift above. After three lifts, a dedicated new ramp is developed 35 m along strike of the original ramp.
Mined stope drives will need to be backfilled with paste fill. Adding 1% cement to the past is planned for backfilling old stopes, 3.5% for active stopes and 7% for undercut stopes.
Post Pillar Cut and Fill (“PP-CAF”)
This method has been designed for those areas which generally have a vertical thickness greater than 5 m, which is the majority of the HW zone. Although the HW zone is well-mineralised, there are erratic patches on internal waste. Pillars will preferably be sited where such waste occurs. The schematic plan in Figure 3.4.3_1 shows how pillars are dominantly at the stope’s outer boundaries.
Access to each stope will be via inclined ramps generally going down from the level galleries in the hanging wall. These ramps will allow access to each stope block’s lower-most 6 m lift. Once all the PP-CAF panels have been mined and backfilled for an entire lift, the stope ramp access is then raised so as to provide access to the next 6 m lift above. This sequence can then be repeated lift-by-lift. Generally, 3 m to 6 m lifts can be accessed from the same original level crosscut access. The technical report then gives an isometric illustration of how this would work, reproduced in Figure 3.4.3_2.
It looks impressive, but it does not give a proper insight into how it works in cross-section. For this, reference had to be made to the previously suggested mining sequence of the HW zone. Figure 3.4.3_3 is much clearer on this.
The above illustration shows the HW Zone as having a true width of 3.6 m when using the bar scale. It all looks a lot less impressive and less efficient in terms of mining recovery and dilution prevention. What about the 6 m lifts? Crux Investor admits it cannot make head nor tail of what is suggested.
Metallurgy and Processing Operations
Metallurgical Test Work
The discussion of metallurgical testwork goes back to findings in 1954, with findings of the 2010 scoping study work in 2010, testing in 2012, and from 2016 onwards and work during 2020 to 2022. Strangely, the actual metallurgical performance on processing between 1960 and 1992 is not provided as a reality check. This period covers production starting with treating a plant feed at a grade of 1.21% WO3, dropping to 0.53% WO3 upon closure. Actual performance over this period would give a good insight into what can be expected.
Based on locked cycle and pilot plant tests, “an overall global mill recovery of 85%, along with a concentrate grade of 65% WO3” is suggested. Crux Investor will work with these numbers.
Processing
Run-of-mine (“ROM”) ore will be either directly fed into the primary crushing system or placed onto a blending stockpile, aimed at a consistent feed quality. The blended ore, nominally sized at minus 400 mm, will undergo primary crushing through a jaw crusher, producing a product with a nominal size of 80% passing (“P80”) minus 100 mm. Crushed ore will be transported via conveyor systems to a covered coarse ore stockpile, which is fed to a two-stage grinding circuit consisting of a semi-autogenous grinding (“SAG”) mill and ball mills. The particle size target will be a P80 of minus 65 microns.
The ground material is first sent to a sulphide flotation circuit consisting of a rougher stage followed by two cleaner stages designed to remove sulphide minerals. The concentrate will be disposed of, and the tailings will be treated in a scheelite rougher flotation circuit. The concentrate is sent to the cleaner circuit, and the tailings to scavenger flotation cells for further recovery. Scavenger tailings are considered final tailings. The scheelite cleaning circuit provides a multi-stage flotation process for the final upgrading of scheelite concentrates derived from rougher and scavenger flotation stages. This circuit comprises four sequential cleaning stages.
Tailings are thickened, and the underflow is sent to the paste plant.
Economic Valuation
Metal Prices Used and Scenarios Analysed
Crux Investor has analysed one scenario in which it adopted all the inputs in the technical report to verify that its model is consistent with the Almonty model and to determine whether its tax calculation arrives at the same number. The 2025 technical report assumes a tungsten price of US$450/MTU APT with a discount of 22% to arrive at the MTU price in concentrate.
The technical report includes the graph reproduced in Figure 3.6.1_1 for the price history of APT since 2012. To place this into context, Crux Investor has annotated the graph by adding a green dot for the price during the last two years of operation (i.e. 1991-1992) as provided by http://www.refractorymetal.biz/nd.jsp?id=4 corrected for inflation to express it in 2018 terms. Since 2018, the US CPI index has risen by 30%, which would make the tungsten price in 1991-1992 approximately US$227 in today’s money terms.
In the last two years of Sangdong production, the feed grade was 0.53% WO3, or 26% higher than the current reserve grade. Applying this to the US$227 would make this US$285/MTU for 1991-1992, adjusted for grade. Considering that mining was unsustainable at that price, one would expect the operation to need a long-term price well above the current US$407/MTU.
The other scenario, the Crux Investor Case, uses an APT price of US$500/MTU in recognition of the rapidly improving tungsten price. The same discount of 22% is used to convert to the concentrate price.
Production Schedule
Crux Investor has adopted the production schedules in the technical report as presented in its Table 16-8. Figure 3.6.2_1 shows processed tonnage and the feed grade over the LOM.
After a one-year ramp-up, assumed to occur during 2026, the plant reaches steady state throughput of 0.65 Mtpa for 12 years and will close down in year 14, which would be in 2039. The plan is to feed higher grades in the earlier years.
Capital Expenditure
With the mine and plant substantially developed and constructed, little capital expenditure remains before the start of production in 2025. Table 3.6.3_1 shows that only US$16.1 million is required in 2025 to complete the initial capital expenditure.
A contingency of 5% is very low, even with an EPC contract. Crux Investor records that the quarterly statement for the period ending 30 June 2025 shows “additions to mining assets” for the year to date of C$14.9 million. The company does not detail where this expenditure was incurred, but it is unlikely that much was spent elsewhere than Sangdong. A capital expenditure overrun can be expected.
The sustaining capital expenditure on mine development seems very low, but there is much existing underground development which could explain the low provision.
The MDA for the period ending 30 June 2025 indicates a restoration provision balance of C$3.2 million related to Sangdong.
Operating Expenditure
Table 3.6.4_1 presents the estimated operating cost as per the 2025 technical report. It also includes the provision used by Crux Investor for its scenario.
Whereas the processing cost provision looks thin considering the relatively fine size of grinding, the complexity of the plant and its small scale will give poor economies of scale, Crux Investor has given it the benefit of the doubt and accepted it for its valuation.
However, the suggested cost rate for mining is something one would expect for a very large-scale bulk mining operation such as one employing the vertical crater retreat method. Mining at Sangdong will have to cope with poor ground conditions, forcing the employment of relatively low-productive mining methods and many ground support measures. At a production rate of less than 0.65 Mtpa this will be a small operation lacking economies of scale. Crux Investor has used US$45/t mined, which is probably still far too low.
The G&A cost rate suggested by Almonty converts to an annual rate of just over US$3 million. In the opinion of Crux Investor, even the smallest formal mining operations will need to spend US$10 million per annum to cover such costs, including marketing, legal, environmental monitoring, security, and training services. Accordingly, it has increased the unit rate to arrive at US$10 million per annum.
Royalties and Taxes
According to the technical report no royalties are payable, but there is a revenue tax of 0.5% payable. A corporate income tax of 21% is applicable along with a local income tax of 2.1% for a total rate of 23.1%.
The report is not clear about how pre-production capital expenditure is amortised and sustaining capital expenditure is depreciated for tax purposes.
Price Waterhouse Cooper (“PWC”) indicates under https://taxsummaries.pwc.com/republic-of-korea/corporate/deductions that straight-line depreciation is usually applied at 20% per annum on vehicles and equipment, and much longer for buildings. Crux Investor has assumed that, on average, 20% would apply to mining assets.
The technical report mentions that a US$15.34 million capital expenditure was incurred prior to production. A tax loss of US$4 million is available, with another US$3 million expected during the 2025 fiscal year. However, when referring to the cash flow statement in the technical report, capital expenditure of US$75.2 million was incurred before year 1 (=supposedly 2025). Crux Investor has included this amount for amortisation in addition to expenditure in 2025.
Moreover, the 2024 financial statements give under note 11 an amount of C$33.0 as “non-capital losses” for Korea. Crux Investor has also used this to offset future taxes.
Results
Table 3.6.6_1 summarises the LOM results for the Almonty and Crux Investor cases.
Using the Almonty inputs, Crux Investor arrives at an after-tax cash flow in Korea that is US$20.3 million higher, which is mostly explained by taxation that is US$22.8 million lower by accounting for non-capital losses available against taxes. Given the close correlation between the results, Crux Investor concludes it has not overlooked anything. Using the technical report inputs, the gross profit margin is 63% which is excellent. However, this only applies because of the low operating cost of US$45.8/t assumed. The technical report arrives at an NPV8 of US$283 million compared to Crux Investor’s US$296 million.
When using the operating cost suggested as more realistic by Crux Investor and accounting for corporate expenses, the cash flow attributable to shareholders drops, despite a tungsten price that is more than 11% higher. The gross profit drops to 44.6% which is respectable, but not impressive. The NPV8 drops by more than 40% to US$174 million.
Table 3.6.6_2 expresses the sensitivity of the project's value as the change in NPV per percentage point change in the main parameters: metal prices, operating expenditures, and capital expenditures.
The sensitivity analysis demonstrates the relatively robust nature of the Sangdong project. The NPV8 increases by 3.0% (US$5.2 million) for every percentage point increase in the tungsten price and drops by only 1.6% (US$2.8 million) for every percentage point increase in operating cost (i.e. US$0.77/t processed). Given the very small size of capital expenditure required, the NPV8 is unsensitive to changes in this parameter, changing by 0.3% for every percentage point increase.
The Enterprise Value of Almonty Industries on 21 August 2025
At the share price of C$5.92 on 21 August 2025, the market capitalisation for the 215.86 million shares is C$1.28 billion, or US$920 million.
On 30 June 2025, the company had 10.1 million warrants, 7.7 million CDI options, and 15.9 million stock options outstanding, all of which were in the money. Another 3.4 million restricted share units were outstanding, with an exercise price of C$1.63.
On 30 June 2025, the net current assets amounted to minus C$13.1 million. Subsequent to 30 June, a private placement of 20.0 million shares raised US$90 million.
Based on the above, an Enterprise Value on a diluted basis for Almonty is derived as C$1,505 million (US$1,090 million), as shown in Table 4_1.
The diluted Enterprise Value is more than 6 times the NPV8 value of US$174 million calculated by Crux Investor.
Another metric to put the Enterprise Value in perspective is to express it as a multiple of the LOM revenue, which is 0.92. From the sensitivity analysis, it is clear that the average tungsten price over the LOM needs to be 175% higher to support the current Enterprise Value. This is not going to happen.
To read the FULL report, for FREE, please subscribe below.
- Notification By Email When Our Latest Notes Are Published With Immediate Access As Soon As They Go "Live"
- Suggest Future Companies To Be Analysed (Launching Soon)
- Additional Related Notes and "How To's" To Aid You On Your Investment Journey.
Already a subscriber? Sign in