Executive Summary
Northisle Copper and Gold Incorporated (“Northisle”) (TSXV:NCX) is a Canadian company that is advancing the North Island gold project on northern Vancouver Island in British Columbia, Canada. This project has a very long exploration history, but despite finding considerable mineral resources, it has yet to be developed into a mining operation. The explanation lies in the very low overall grade of the deposits.
However, the share price has come alive lately, and Crux Investor decided it should take a closer look.
The latest technical milestone reached by the Northern Island project is the release of a preliminary economic assessment (“PEA”) dated 12 February 2025, the document on which this valuation is based. The resources that have been defined are within three deposits: Hushamu, Red Dog, and Northwest Expo (“NWE”). The mineralisation contains Cu-Au-Mo and some Re and is emplaced within the upper reaches of porphyry systems. The intensity of mineralisation and metal zonation is strongly associated with the type of alteration around the porphyry systems. Northwest-trending thrust faults are the primary control on the emplacement of mineralising porphyry bodies. Hushamu is by far the most important deposit in terms of mineral resources. It, however, is also the lowest grade deposit. The business plan in the PEA converts roughly 75% of the metal contained in total resources into plant feed at grades that are roughly 12% higher. Of the mineable inventory (= the plant feed over the life of mine) Hushamu accounts for 87% of the contained Cu and 76% of the Au. The grades are, however, very low at 0.17% Cu and 0.26 g/t Au. The credits from Mo (at 0.009%) and Re (0.45 ppm) help sweeten things.
At such grades, a project needs some favourable aspects. Jurisdiction is excellent, the location close to several harbour options will be a great help, a very low stripping ratio of 0.83 is a great advantage, and the bulk nature of the deposit will allow for the deployment of very large equipment and a high annual throughput for economies of scale. However, what has really made a difference lately is a sharp rise in the gold price.
In addition to the above, the business plan envisages a first phase of operation for the initial five years, when the higher-grade Red Dog and NEW deposits are planned to be mined. After this phase, production is planned to double plant throughput upon the start of operations at Hushamu. Such a phased approach reduces the upfront funding requirement.
The PEA further reduces upfront funding requirements by including optimistic capital provisions, especially for the process plant. At US$281/monthly tonne capacity for the initial plant and US$224/monthly tonne for the expansion module, the provision is probably half what is required. This is in particular because the plant will comprise a crushing/milling and flotation circuit and a cyanide leaching section to produce gold in doré. The contingency in the capital estimate amounts to only 18.7% of the sub-total before the contingency. For a PEA level study, this is too low and has been raised to 25% by Crux Investor and also applied to sustaining capex.
As is usual with technical reports that fail to benchmark their operating cost estimates with actual cost of similar operations, the unit cost provisions were found to be too low. With three other operations as a comparison, Crux Investor amendments resulted in an overall increase of 24% in cost per tonne milled to US$14.8.
Another way in which the PEA helped to arrive at a positive conclusion was metallurgical performance based on unrepresentative high-grade composites used for the testwork. Crux Investor has used scatter plots in this review to demonstrate how the testwork results are unrepresentative compared to the mineable inventory grades. Based on the scattergrams, the Crux Investor model includes distinctly less favourable metallurgical performance parameters. These resulted in Cu and Au production being around 11% lower in the Crux Investor model, with Mo especially much affected, being 90% lower and Re 51% lower.
Despite the interventions by Crux Investor stressing the input parameters, the evaluation arrives at a NPV7 of US$0.99 billion compared to the C$1.48 billion in the PEA. However, with the phased approach, the project's payback period is 6.5 years on an undiscounted basis. Crux Investor deems 8% to be a more appropriate discount rate for a project than 7% suggested by Northisle. At a ratio of NPV8 / Initial Capex equal to 0.57 this is still a decent result.
The results are still decent because of the very forgiving rise in metal prices, especially gold. The spot price of US$3,372 used in the Crux Investor valuation is 57% higher than the gold price of US$2,150/oz assumed in the PEA. At this level, gold accounts for more than half the project's gross revenue.
The PEA results were well-received, based on the rise in share price after the announcement. However, the share price was really propelled upwards after 20 May 2025. The listing on the OTCQX market may have something to do with it, but more likely endorsement of management strategy to add higher-grade resources in the Red Dog and NWE areas and initial encouraging drilling results there. Moreover, the Wheaton Precious Metals Corporation (“Wheaton”) decision to support a share placement of C$5 million is a vote of confidence from a reputable industry insider.
Crux Investor calculates a diluted Enterprise Value of US$256 million, effective 5 August 2025. This amounts to US$15/oz AuEq in total mineral resources. At 0.5% of the gold price, this is a low valuation and may have been the reason for attracting such good funding support. Not much needs to happen to improve the economics further. Examples are success in adding higher grade resource near Red Dog and NWE and proving through metallurgical testwork that at mineable inventory grade, the recoveries in the PEA really do apply and that molybdenum and rhenium can successfully be separated in a clean concentrate at high recoveries.
As pointed out in the previous Analyst’s Notes (on Newcore Gold) a company is usually valued at 0.2-0.3x the NPV8 value of a PEA, which would make the value of Northisle around US$237 million, slightly less than its current value. However, Crux Investor has stressed inputs to the cash flow model and included many conservative assumptions, something other market analysts will probably not do. Crux Investor is realistic enough to understand its influence and that others will rate the company more generously. They will push a re-rating by accepting the PEA inputs and pointing to much higher metal prices than assumed by the PEA. Table 22-8 of the technical report points to a post-tax NPV8 of US$3.34 billion at “spot metal prices”, which is 92% higher than the NPV8 of the PEA base case. Perceptions count more than realistic assumptions for a share’s prospects.
In conclusion, Northisle Copper and Gold is a good investment opportunity, provided the current high gold price is maintained in the long run.
Introduction
Northisle Copper and Gold Incorporated (“Northisle”) (TSX:NCX) is a Canadian company that is advancing the North Island project in British Columbia, Canada.
The project is situated between 15 km and 40 km southwest of Port Hardy on northern Vancouver Island and contains the Hushamu, Red Dog and Northwest Expo deposits and multiple other partially explored copper-gold porphyry occurrences. The tenements cover a west-northwest trending 40 km x 8 km area. The company’s first involvement dates back to 2011 with numerous other parties having been involved since the 1960’s. The reason why the history goes this far back without mine development is the very low-grade nature of the drilled deposits. Lately however, the share price has come alive as is shown in Figure 1_1, which gives the price performance on the TSX over the last five years.
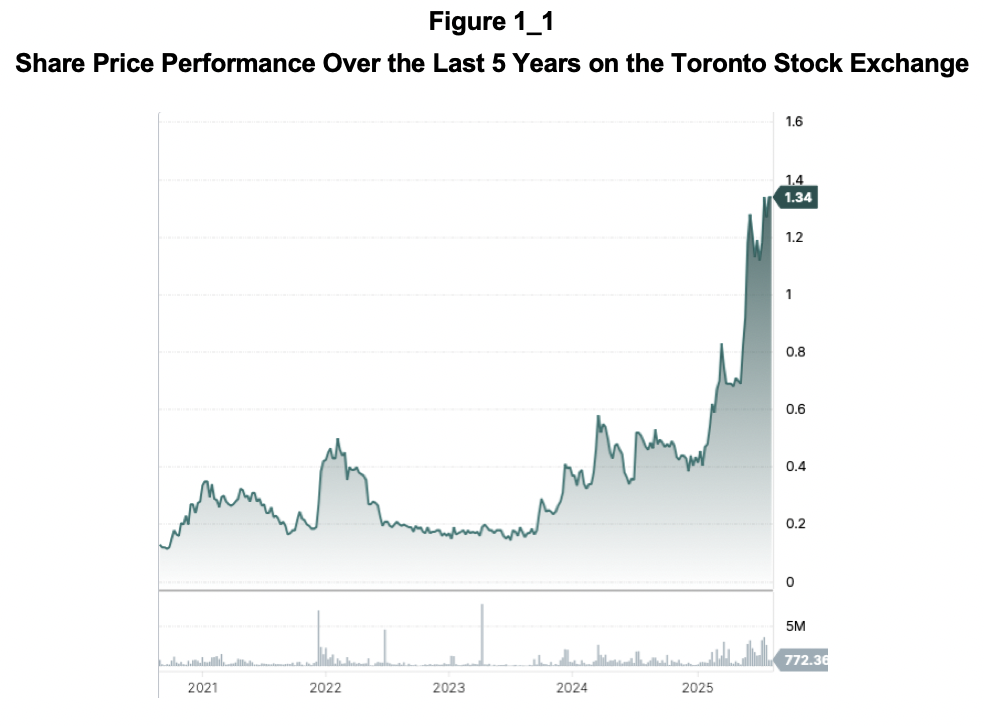
The sudden price explosion has piqued the interest of Crux Investor to look deeper into company’s prospects.
Valuation of the North island Project
Background
The information in Section 2.1 to Section 2.6.5 of this report are derived from a NI.43-101 compliant technical report dated 12 February 2025 reporting on the findings of a PEA and authored by Ausenco. Any amendments by Crux Investor will be clearly signalled.
The North Island project covers a west-northwest-trending 40 km x 8 km area north of the Holberg Inlet, 25 km west of Port Hardy, on northern Vancouver Island, B.C. (see Figure 2.1_1).
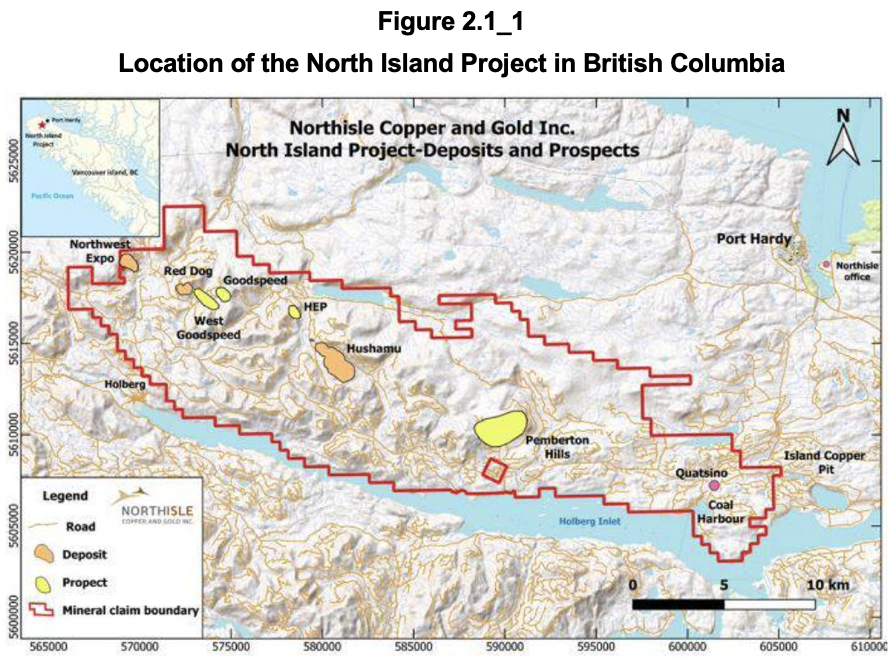
The deposits indicated in orange on the map comprising the project can be accessed from Port Hardy by a paved road to Coal Harbour at the East of the tenement area and then via well-maintained logging roads.
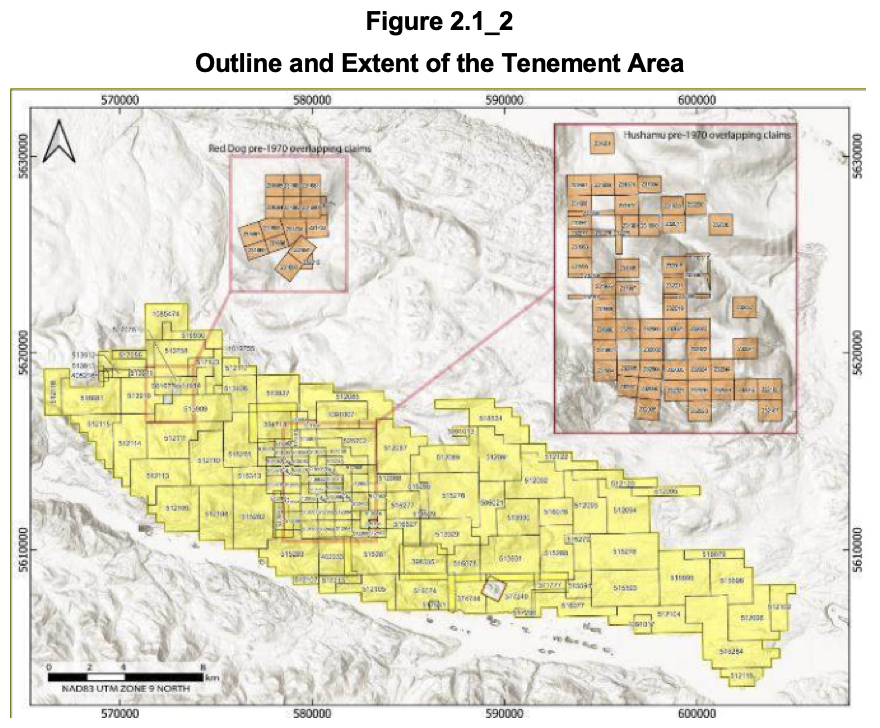
The tenement area is 342 km2 large consisting of a contiguous block of 214 claims, being 140 contiguous modern claims in yellow in Figure 2.1_2 and 74 smaller pre-1970 claims (in brown), which largely overlap modern claims in the areas surrounding the Hushamu and Red Dog deposits.
A portion of the claims underlying the project (historically known as the Expo claims) are subject to a 10% net profit royalty now owned indirectly by Royal Gold, Inc., and a C$1 million cash payment is payable to Sirit Incorporated. Certain other claims (historically known as Apple Bay claims) require a C$0.8 million payment (in cash or shares) to be made to Electra Gold Ltd. in the event of a production decision on those claims. The 16 claims that comprise the Red Dog property are subject to a 3% Net Smelter Returns (“NSR”) royalty, of which 2% can be repurchased for C$2.0 million. For the location of the mentioned deposits refer again to Figure 2.1_1.
The Northern Island project has been around for a very long time with exploration and drilling dating back to 1965. Northisle got involved as far back as 2011. The company executed drilling programmes in 2012, 2014, 2017 and 2021-2022. The project was obviously a hard nut to crack.
Geology and Mineralisation
The Hushamu, Red Dog, and Northwest Expo deposits host Cu-Au-Mo-Re mineralisation within the upper reaches of porphyry systems. Mineralisation is hosted within the intrusive rocks and/or the host rocks and consists of quartz stockworks, veinlets, disseminations and replacements within large hydrothermally altered systems. Intensity of mineralisation and metal zonation is strongly associated with the type of alteration around the porphyry systems. Northwest-trending thrust faults are the primary control on the emplacement of mineralising porphyry bodies.
Hushamu is by far the most important deposit in terms of mineral resources. The mineralized zone here extends 2,500 m in a NW-SE direction, dips 25 degrees north, extends 860 m down dip and has an average thickness of 380 m. Three alteration zones are recognised: the Leached Zone (“LEA”), The silica-clay-pyrite (“SCP”) alteration zone and the chlorite-magnetite (“CMG”) zone.
The LEA alteration zone occurs at the upper part of the Hushamu lithocap SCP alteration. This leached zone of SCP (in blue in the NS cross section in Figure 2.2_1), ranges from 50 m to 200 m thick, in which there is no significant copper or gold.
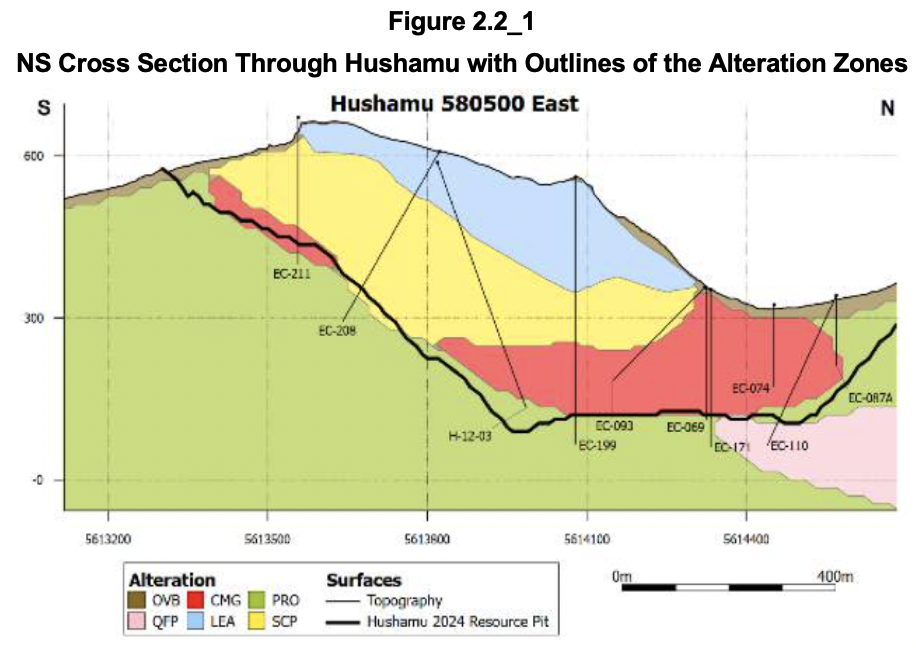
The silica-clay-pyrite (“SCP”) alteration zone (in yellow in Figure 2.2_1) is below the Leached Zone and contains 10%-20% pyrite, the copper mineralisation occurs as blebby and vein chalcopyrite (CuFeS2) and lesser bornite (Cu5FeS4) and the highest molybdenite (MoS2) and rhenium concentrations of the three alteration zones. CMG alteration (in red in Figure 2.2_1) underlies the SCP alteration. In this zone copper mineralisation is highest.
The Northwest Expo deposit (“NWE”) comprises a semi-tabular body that extends over 730 m in the NW-SE direction, over 400 m downdip and averages 120 m thick. Similar to the Hushamu deposit, at NWE there are SCP, CMG, and chlorite-zeolite-carbonate (“CZC”) (recorded as propylitic at Hushamu) alteration domains. A generalised section is shown in Figure 2.2_2.
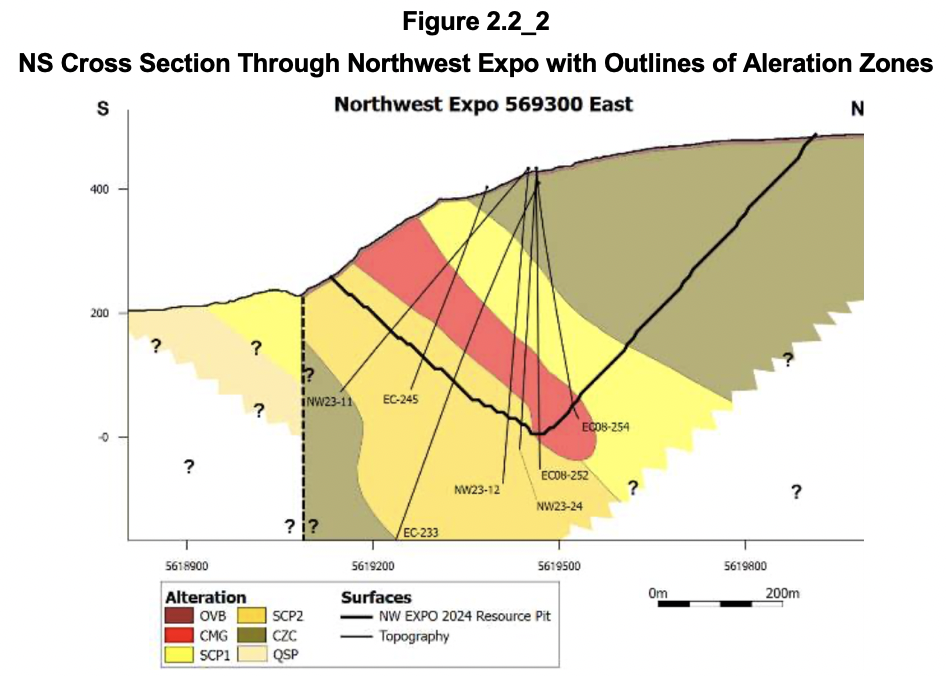
SCP1 (in bright yellow) is above the CMG (in red) and SCP2 (dirty yellow) below the CMG alteration. The SCP1 and SCP2 alteration envelope essentially forms the boundary within which the resource has been modelled. Within SCP pyrite comprises 10%–20% of the rock. The CMG alteration is analogous to CMG at the Hushamu deposit and identical in appearance. SCP1 at its upper levels has background to low copper-gold-molybdenum-rhenium assay grades. Towards the basal 50 m of the contact between SCP1 and CMG the gold grade becomes generally significant (>0.1g/t Au) along with molybdenum (>250 ppm Mo) and associated rhenium (>0.5 ppm Re) grades. This increases down to the contact and diminishes progressing down through the CMG alteration. Conversely, copper grades are mostly low to background in SCP and generally increase abruptly at the SCP1 / CMG contact. In CMG copper mineralisation occurs as disseminated chalcopyrite and minor bornite and chalcocite (Cu2S) associated with hydrothermal magnetite. The gold grades at NWE are significantly higher than Red Dog and Hushamu.
The Red Dog deposit is centered on a Quartz-Magnetite Breccia (“QMB”) which forms a 350 m x 150 m west-northwest trending body between major ENE-trending faults. Six alteration types have been recognised in the Red Dog area of which two are important for mineralisation: quartz-magnetite breccia (“QMB”) indicated in purple on the map in Figure 2.2_3, and Intermediate Argillic Alteration (“CMG”) in light brown on the map. The resource outline is indicated as an interrupted red line.
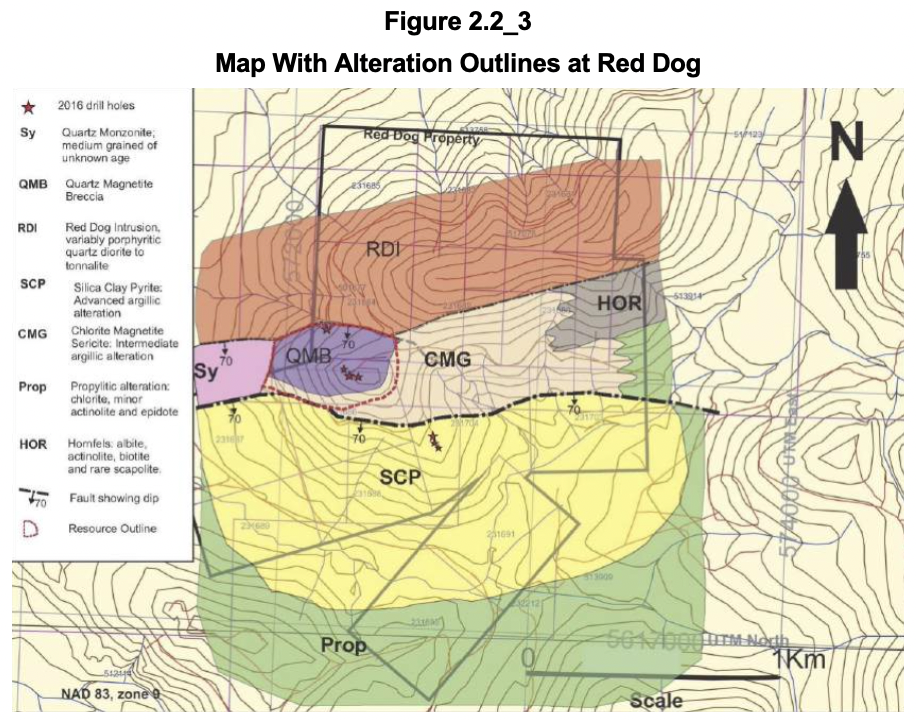
Together with mineralisation in CMG the Red Dog deposit extends 730 m NW-SE by 400 m width and 120 m thickness, but occurring predominantly in the QMB.
In conclusion mineralisation and metal grades are dominantly determined by the type of alteration and the best metal grades are not coincident. Better Mo and Re grades are unfortunately generally not associated with better copper and gold grades.
Mineral Resources and Mineral Reserves
Mineral Resources
The discussion in the PEA on how the mineral resources were derived is very brief.
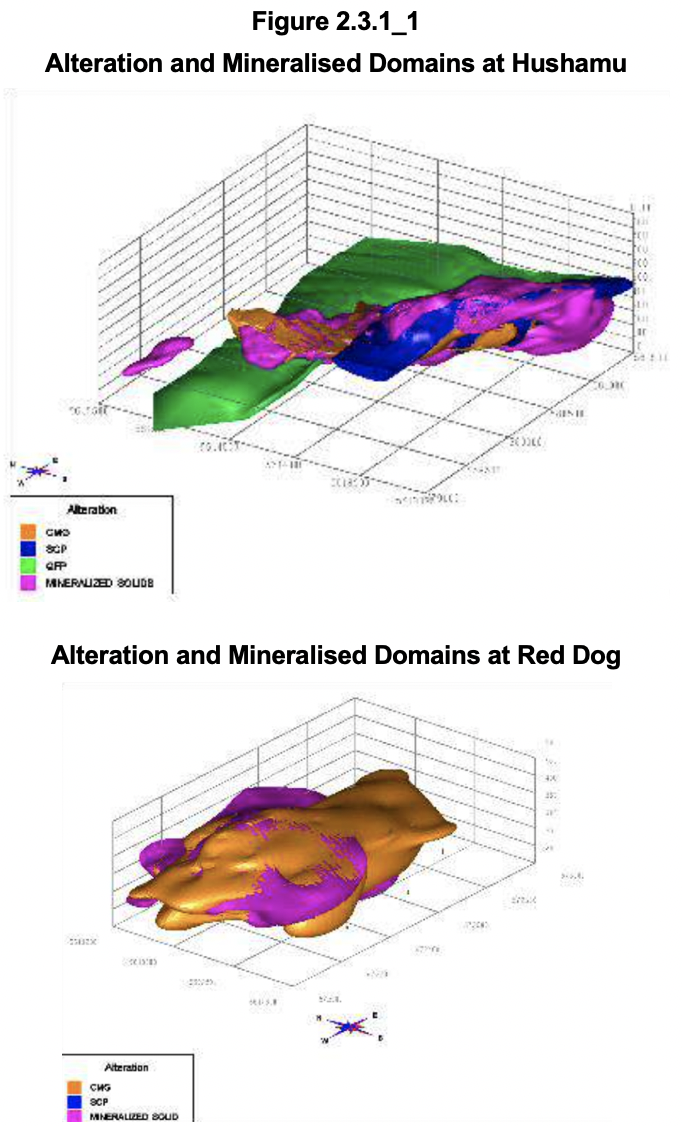
At each deposit, three-dimensional solids have been created of the alteration/lithologies to aid in the orientation and extent of the mineralised domains. Figure 2.3.1_1 shows such solids for Hushamu and Red Dog as examples.
The selection of capping levels for the various metals for the various deposits was based on cumulative probability plots before compositing. Capping results in minimal changes in the average grade. The coefficients of variation (“CV’s”) are around 1.0, even for gold, which is impressively low. A composite length of 3 m was chosen with boundary bordered being honoured. Correlograms have been created for each domain, and each deposit. The presented graphs for the semi-variograms all look very well defined.
The chosen block size for NWE and Red Dog is 10 m x 10 m x 10 m and 20 m x 20 m x 15 m for Hushamu, reflecting the bulk nature of the mineralisation. Block grade estimation of Au, Cu, Mo and rhenium values was done by ordinary kriging (“OK”). According to the technical report visual verification includes a series of E-W and N-S sections every 20 m through the block models and plans at 10 m intervals. Figure 2.3.1_2 includes two examples of such cross sections.
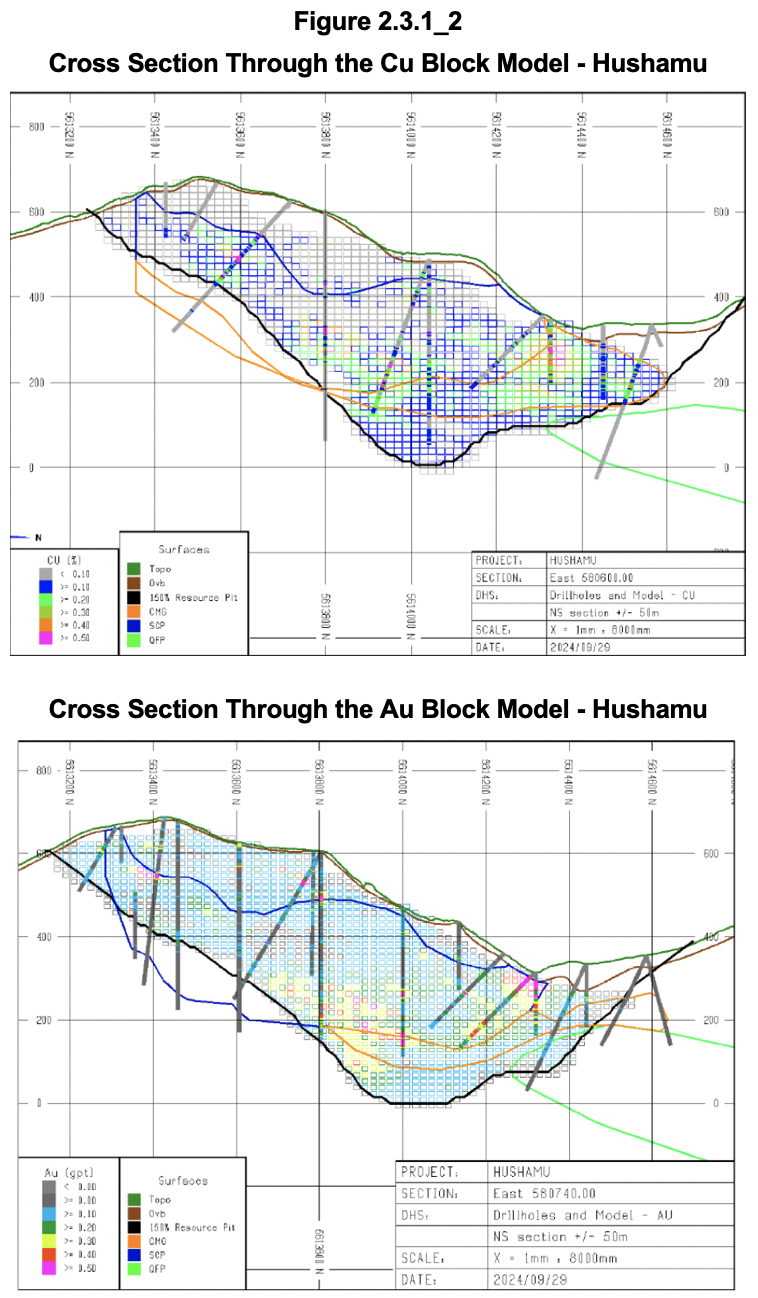
The correlation between block grade and borehole assays looks reasonable except for the higher Au grades at the bottom of the pit outline not obviously supported by borehole results. This could however be supported on a parallel section.
Table 2.3.1_1 gives the mineral resource statement, effective 23 September 2024, authored by Moose Mountain Technical Services (“MMTS”).
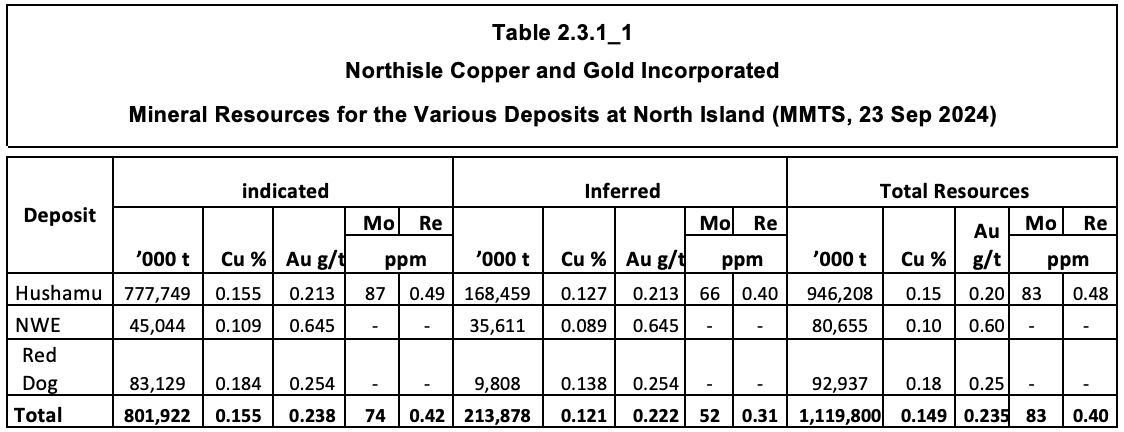
The table shows that the resource grades are very low and must have been estimated using very favourable economic inputs to drop the cut-off grade to a very low level.
Of the resources 81% of the tonnage has been classified as Indicated with 84% of the contained copper and 82% of the contained gold in this category. This usually a high enough proportion to consider completing a feasibility study. However, the confidence level of completed studies is generally too low for such a study. Hence the PEA.
Mineable Inventory
Drafting a PEA allows for Inferred resources to be included in the business plan. The total material in such a plan can be referred to as Mineable Inventory.
The pit optimisation uses undiscounted cash flow which down plays the importance of the economic impact of early stripping. This is very much compensated by assuming a low gold price of US$1,910/oz, which in turn is compensated by assuming far too low unit operating cost, which will be discussed in Section 2.6 4 of this report.
The conversion of resources to mineable inventory accounts for the dilution in the block grade by using a large block size for the resource estimation. On top of this 4% dilution is estimated to result from mining beyond the edges of mineralised blocks. Table 2.3.2_1 shows the declared Mineable Inventory.
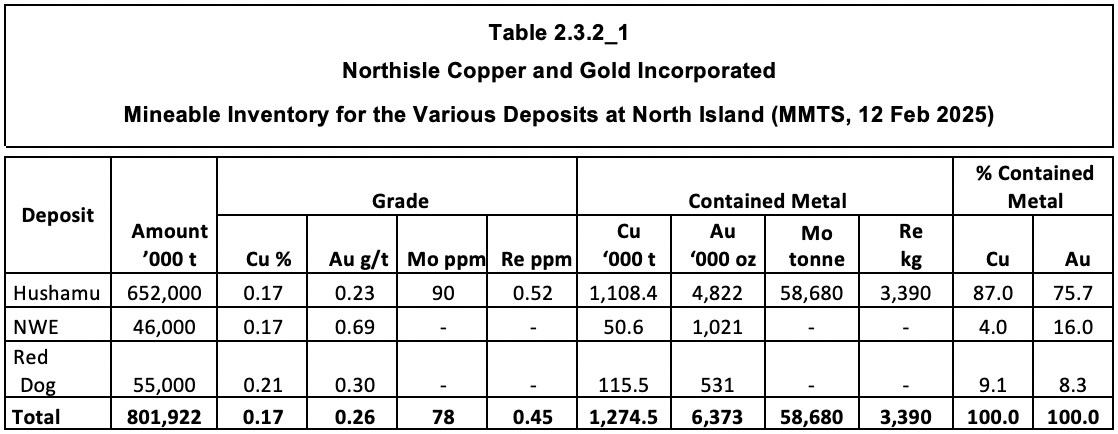
The table illustrates that Hushamu is by far the largest deposit, but also having the lowest grades. That is why the company plans to mine NWE and Red Dog in the early years (Phase 1 covering the first five years) followed by Phase 2 with treating Hushamu material at double the throughput rate of Phase 1.
Comparison between Mineral Resources and Mineable Inventory indicates that approximately 75% of the contained metal is converted to plant feed at a grade that is 11% - 14% higher, despite the assumed 4% dilution.
Mining Operations
The plan is to mine the deposits by conventional open pit operation, based on large scale conventional drill/blast/load/haul mining methods and as owner operator. With production starting at Red Dog, the primary crusher is planned there with crusher ore planned to be conveyed to Hushamu in due course. This means that a considerable proportion of ore needs rehandling from the stockpile at Hushamu to feed the plant there. Figure 2.4_1 shows the mine layout at Red Dog and NWE at the top and at Hushamu at the bottom.
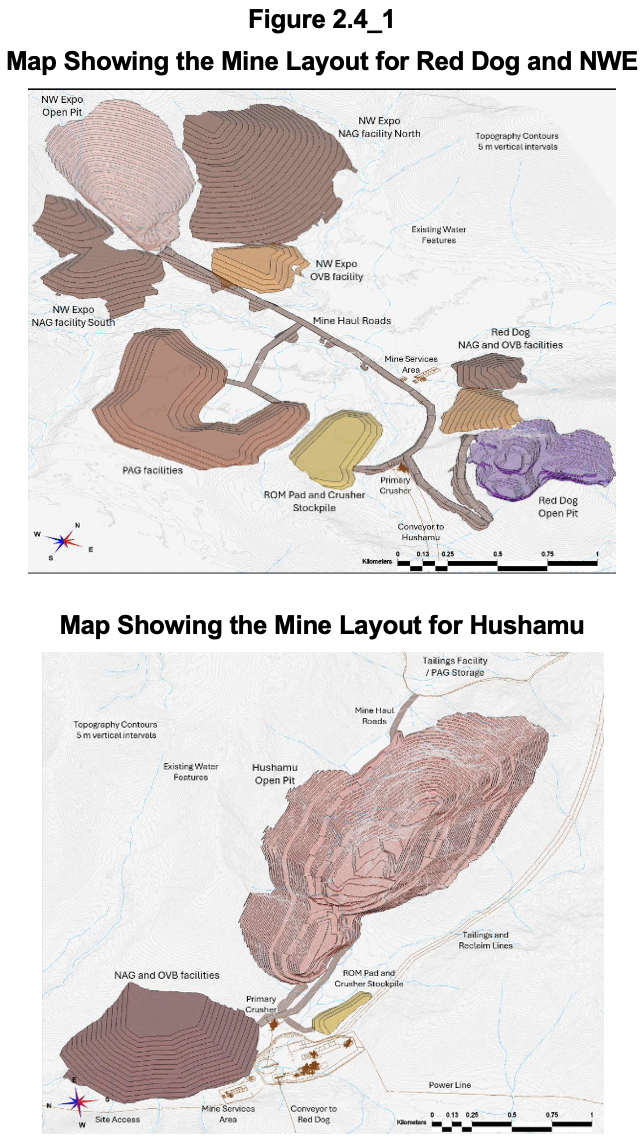
Topsoil, overburden, and non-acid generating (“NAG”) and potentially acid generating (“PAG”) waste rock mined from the open pits will be hauled to ex-pit storage facilities. This means that a measure of grade control (i.e. requiring analysis for sulphur and calcium) is required to identify and keep NAG and PAG waste separate. PAG waste rock mined from the Hushamu pits is planned to be deposited sub-aqueously within the tailings dam facility. Overburden will be stockpiled for when mine closure requires return of this. The PEA estimates that 74% of the waste mined will be PAG. Such a large proportion can be expected to present problems for disposal, especially when the start-up at Hushamu involves substantial pre-stripping.
In conclusion, material handling involved with mining will be substantial and add to the mining cost.
Metallurgy and Processing Operations
Metallurgical Test Work
According to the technical report seven metallurgical programs have been carried out dating back to 1989 and including “in progress 2024”. It should be noted that no press releases relating to the 2024 testwork have been issued. Crux Investor takes this as an indicator that no material changes have occurred since the publication of the PEA report.
Of the seven programs two only tested for rougher flotation, which is only one step in the planned process. The process involves a conventional copper flotation flowsheet designed to recover all sulfides into the rougher concentrate, followed by regrinding and flotation cleaner stages. Selective pulp chemistry conditions and fine regrinding were required in the cleaner circuits to reject pyrite and produce marketable copper concentrates. Regrinding of the rougher concentrates is to P80 minus 20 microns. Given the amount of pyrite in the feed relatively much material will need regrinding.
Comminution tests indicated that the mineralisation at the various deposits is moderately soft with respect to semi-autogenous grinding (“SAG”) milling, but moderately hard with respect to ball milling. Hushamu SCP material has average abrasiveness, while the other zones are rated less abrasive.
Much of the discussion deals with rougher flotation results, but somehow the conclusion on final metal recoveries includes leaps of faith with respect to Mo and Re recovery. To quote:
It is proposed that bulk copper concentrate generated from Hushamu material would be processed through a Cu-Mo separation circuit to recover a molybdenum concentrate. No Cu-Mo separation circuit testing has been completed to demonstrate the metallurgical performance of this process, however Mo recovery of 90% across the circuit has been estimated as a reasonable industry standard for porphyry Cu-Mo deposits. Rhenium is expected to be associated with molybdenite, therefore rhenium recovery to the final Mo concentrate is expected match molybdenum recovery. An additional 90% factor is applied to the final rhenium recovery to reflect unforeseen processing losses.
As can be seen the suggested performance is not based on actual testwork and totally speculative. To refer to “industry standard” is not appropriate for a deposit that is much lower grade than “industry standard” and has a much higher pyrite content.
What stands out from the testwork is that composites were used that have unrepresentatively high grades compared to the mineral resource grade. Crux Investor has generated scattergrams to determine whether there is a relationship between feed grade and recovery and found this clearly to be the case. Figure 2.5.1_1 shows the relationship for Cu from the Hushamu mineralisation.
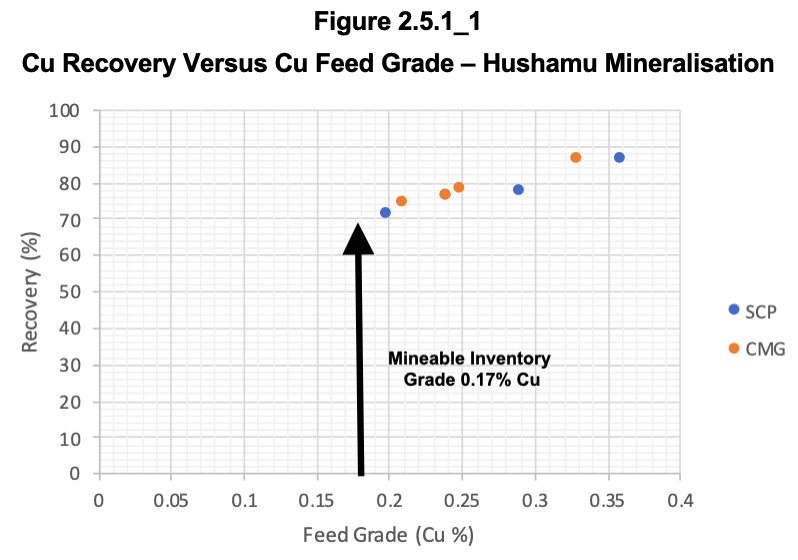
The diagram shows a close relationship for four composites of CMG mineralisation and four samples (one results is covered by a CMG result) of SCP. The arrow has been added to illustrate that all composites used have clearly higher copper grades than the average mineable inventory grade. It indicates that a Cu recovery of 70% should be applied over the life of mine (“LOM”), not the 77%-81% suggested in the PEA.
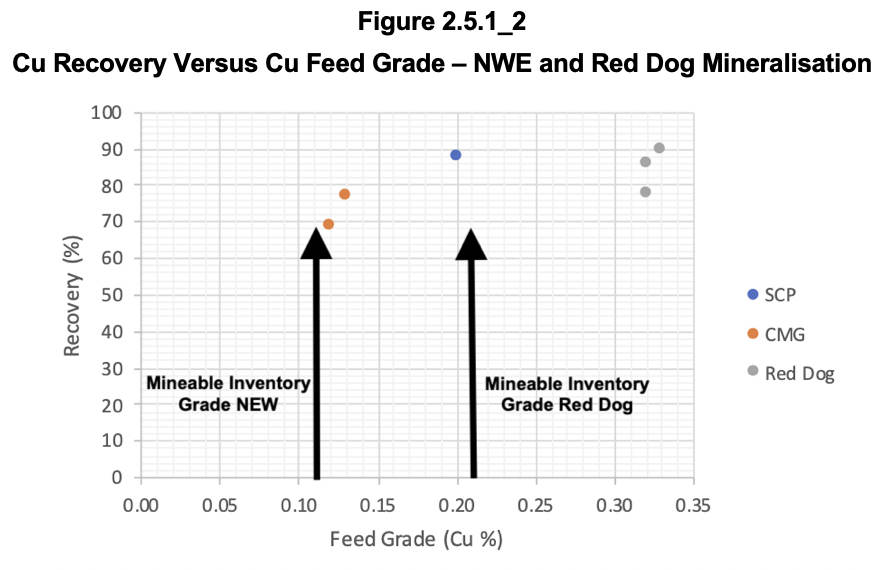
Figure 2.5.1_2 shows the same relationship, but for SCP and CMG mineralisation at NWE and for Red Dog (grey dots). Again much higher-grade composites were used for the testwork than the average grade of the mineable inventories for these deposits. For the PEA a recovery of 70% should be used for the NWE deposit and 80% (at best!) for Red Dog.
The same pattern is seen for gold recovery versus feed grade at Hushamu and the other deposits, refer to Figure 2.5.1_3 and Figure 2.5.1_4.
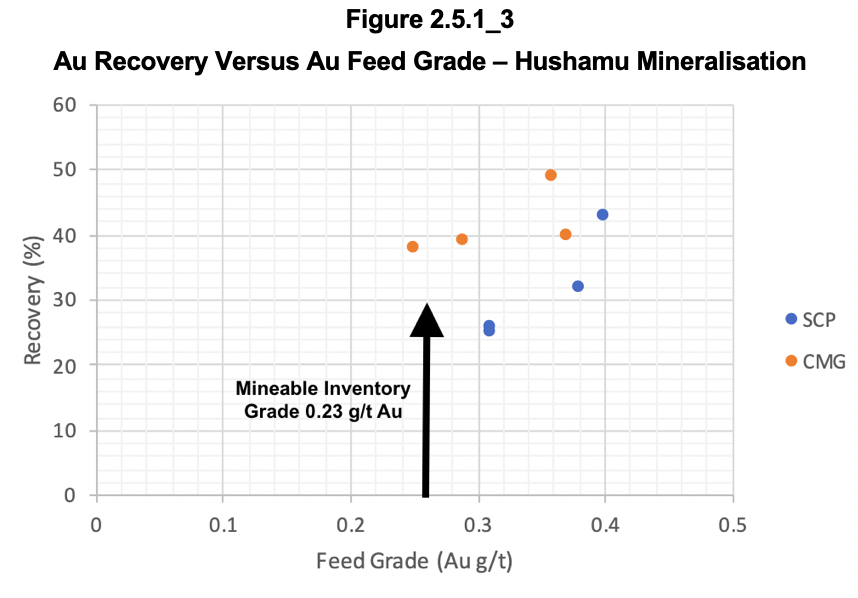
The relationships above imply that a gold recovery into Cu concentrate of 25% should be used for SCP and 40% for CMG.
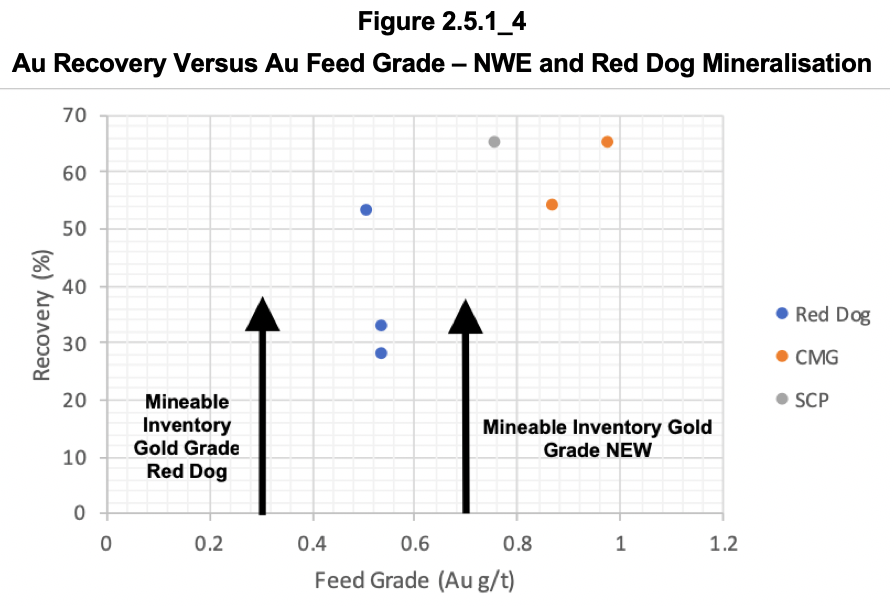
The relationships above imply that a gold recovery into Cu concentrate of 30% should be used for Red Dog and 45% for CMG at NWE and 60% for SCP at NWE.
Figure 2.5.1_5 shows the relationship for Mo at Hushamu (the other deposits do not have Mo of economic interest).
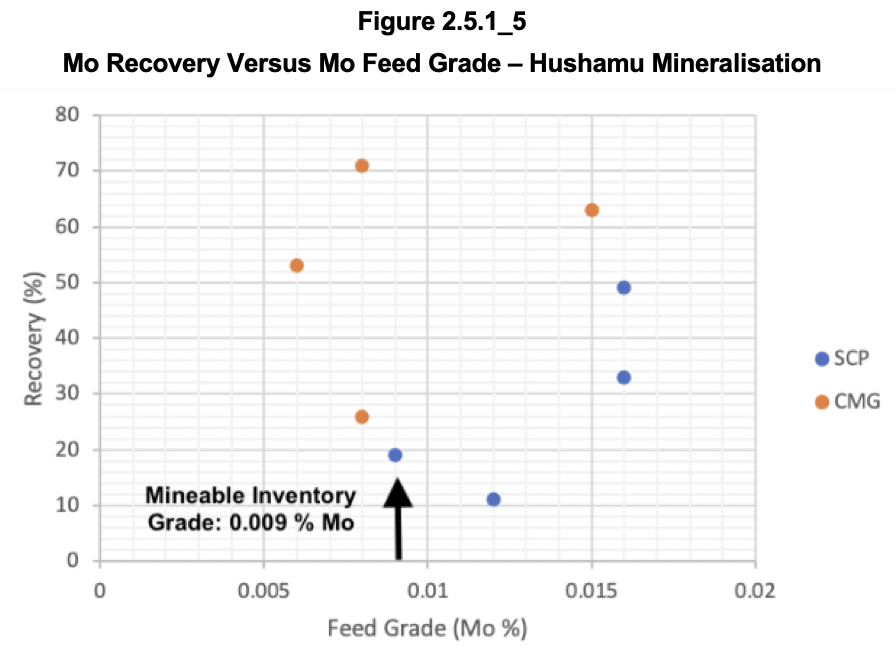
Implied from the graph above is that the Mo recovery is very grade sensitive for SCP and insensitive for CMG. The recovery at mineable inventory grade should be respectively 15% and 50%.
To enhance gold recovery, cyanide leaching of the pyrite-rich cleaner tailings was investigated, as well as rougher tailings generated from NWE and Red Dog materials. For Hushamu recoveries between 45% and 53% were reported from the cleaner tailings and between 75% and 80% from leaching the rougher tailings from the other deposits. Unfortunately no information was provided about the feed grade to determine whether these are representative. However the graphs in Figure 2.5.1_6 were provided for leaching variability samples from NWE.
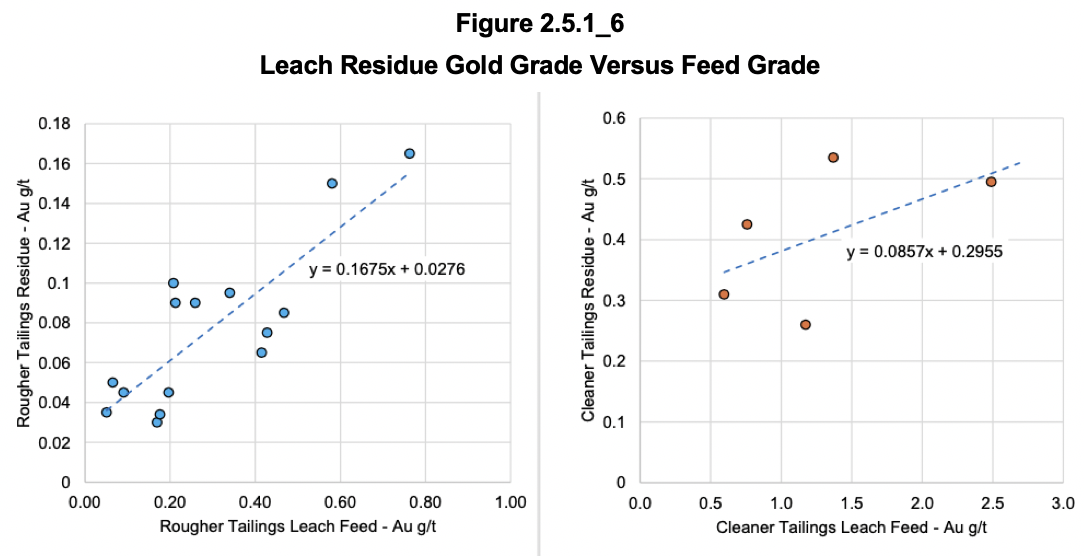
The graphs make no sense at all. It is impossible for the feed grades to exceed the feed grade to the flotation circuit as many ounces are captured in a small amount of copper concentrate, leaving less ounces for almost the same amounts of tailings as the tonnage fed. Based on an indicated mass pull to Cu concentrate of around 1% in the plant design, the cleaner tailings grades would be between 0.05 g/t Au and 0.13 g/t Au, which are a fraction from what is shown above.
Based on the above, Crux Investor would caution the reader to accept the suggested recoveries and has generated its own numbers. Table 2.5.1_1 reproduces the recoveries suggested in the PEA for the various metals at the various deposits and their types of mineralisation, below which Crux Investor has made the same calculation but with inputs that have been amended based on the above graphs (cells indicated by a blue colour).
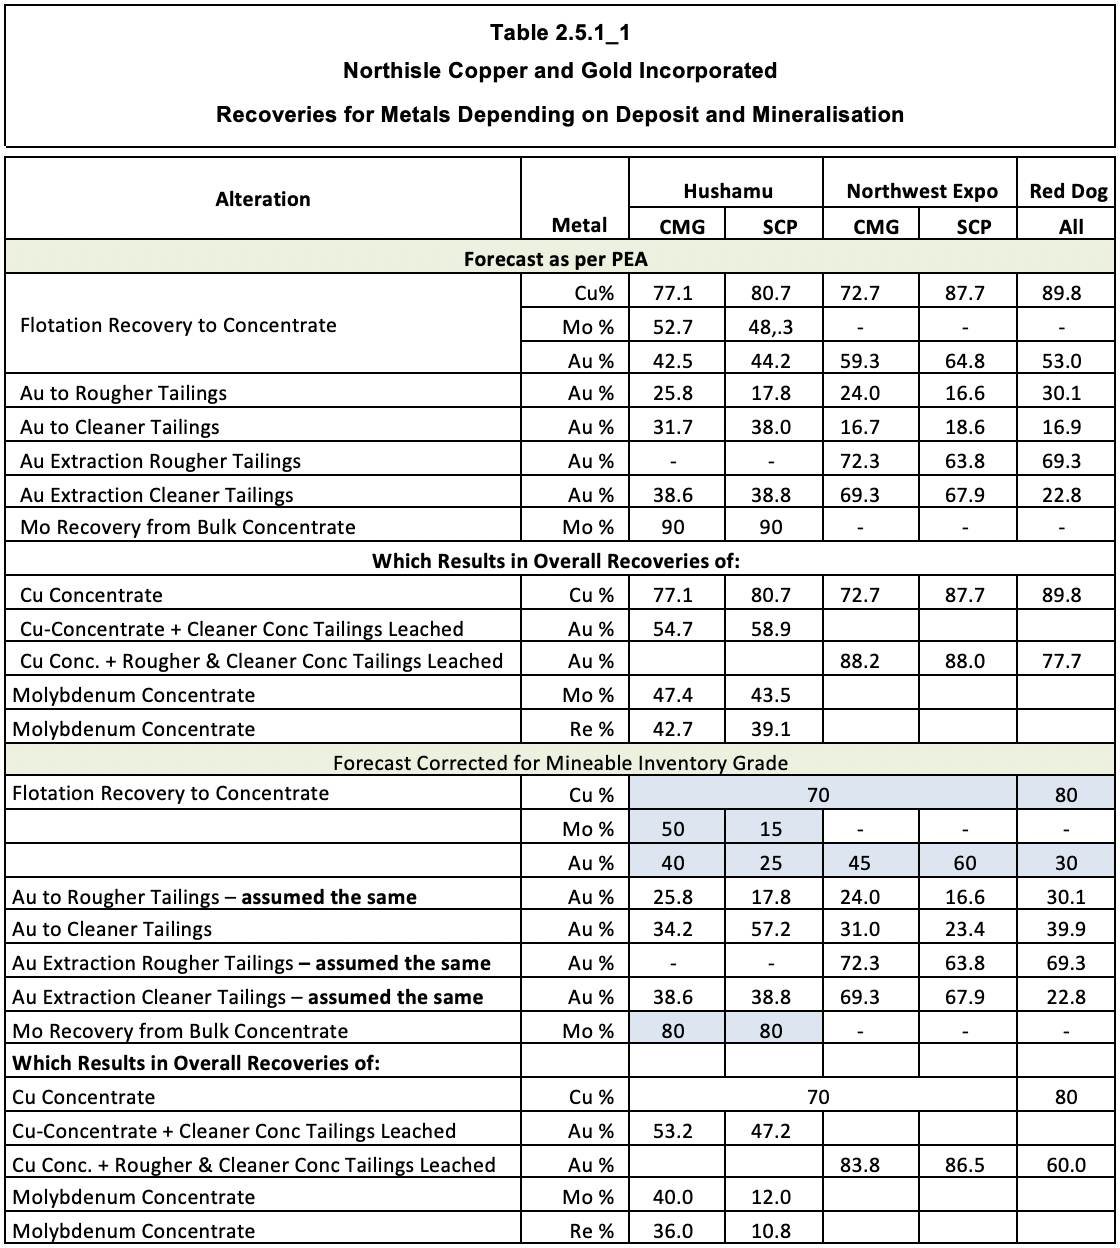
The way to read the table is that the final overall Cu recovery is the same as recovery to Cu concentrate. The Mo recovery is the recovery to the Cu concentrate times the recovery to Mo concentrate (90% as per PEA, 80% as per Crux Investor). Please note that both numbers are pure guesstimates. The Re recovery is the Mo recovery times 90%, again a pure guesstimate with no testwork completed to substantiate it.
The gold recovery is the sum of recovery to Cu concentrate plus the leaching recovery of gold in the cleaner tailings for Hushamu and this total plus the leaching recovery for rougher concentrates for NWE and Red Dog. Please note that, despite misgivings, Crux Investor has assumed the same proportion of gold reporting to rougher tailings which results in a different proportion reporting to cleaner tailings (the sum of all needs to be 100%). The overall results are a downgrading of all recoveries, for Au, Mo and Re substantially, for Au less so as the leaching recoveries were given the benefit of the doubt.
Apart from recovery the quality of products is also economically important as it determines the amount of metal that will be paid for by offtakers. As is observed in the PEA “the pyrite to copper sulphide ratios ranges from 6 to 28 in the samples tested, with the highest ratios in Hushamu SCP material. These elevated pyrite ratios require selective pulp chemistry and fine regrinding to generate marketable copper concentrates”. One would therefore expect concentrates with relatively low copper and molybdenum contents.
Unfortunately, the discussion in the PEA report also falls short here as it does not give a clear conclusion what it forecasts. Similarly as for information for recoveries obtained, it includes in its Table 13-4 on flotation testwork results for the quality of cleaner concentrates. Figure 2.5.1_7 shows the Cu-content in concentrates as function of head grade for Hushamu composites.
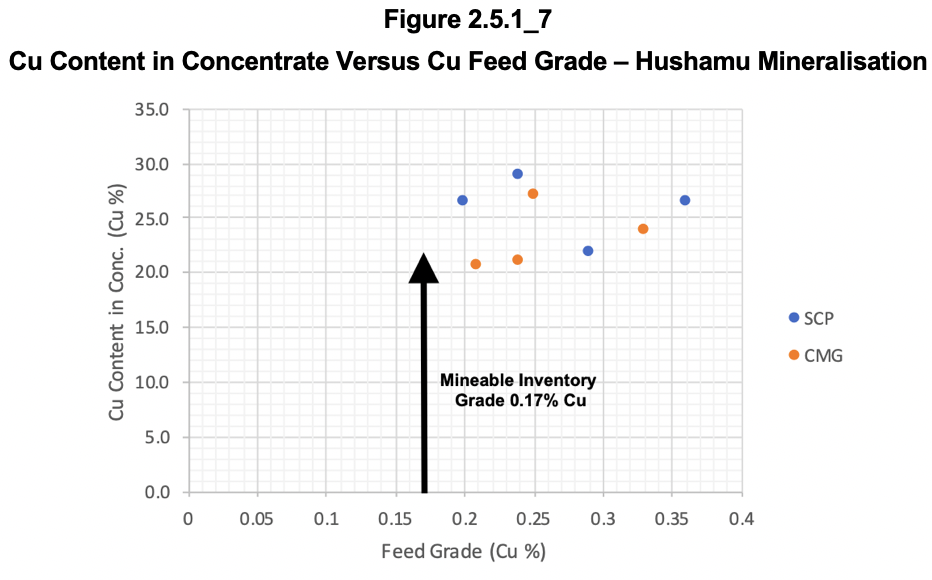
The results above are surprising with very high Cu-contents for relatively low feed grades. However, these feed grades are totally unrepresentative. There is a clear relationship and Crux Investor concludes that a concentrate grade of 22% Cu can be expected at the mineable inventory grade. Without graphing it, the results for NWE and Red Dog seem similar.
The leap of faith with respect to achieving a Mo concentrate at a 90% recovery without supporting testwork comes with the additional shortcoming of not providing information about the concentrate quality. Crux Investor has referred to the technical report dated September 2024 for the Thompson Creek project of Centerra. This deposit has a Mo grade that is almost eight times higher than the Mineable Inventory grade of North Island. The technical report forecast a recovery of 90.5% (almost the same as the Northisle PEA suggests!) for a concentrate grading 53.6% Mo.
Processing
Based on the preliminary testwork a process flow is proposed that includes single stage crushing, semi autogenous grinding (“SAG”) milling, ball milling, bulk flotation, and separate rougher and cleaner tailings leaching. The first module of the plant will treat Red Dog and NWE mineralisation at a processing rate of 40 kt/d (i.e. 14.6 million tonnes per annum (“Mtpa”)). For treating mineralisation from Hushamu after the first five years another 40 kt/d module will be constructed, but also a pebble crusher circuit to assist SAG milling and a molybdenum flotation circuit will be constructed to process the bulk concentrate, separating copper and molybdenum. The leaching circuits will be reconfigured to treat cleaner tailings only.
Grinding of the feed will be to a particle size of P80 minus 150 micron. The bulk concentrate that needs regrinding for cleaning will have a mass pull of 13% for NWE and Red Dog, increasing to 19% for Hushamu. Regrinding will be to P80 minus 15 microns. This will add substantially to processing cost.
Economic Valuation
Metal Prices Used and Scenarios Analysed
Usually Crux Investor recreates the cash flow model of the technical report to verify all issues were properly covered and the tax calculation arrives at the same overall sum. However, in the case of the Northisle PEA too many inputs are missing for this to be possible. Table 16-6 of this report with the production schedule is full of informational gaps such as leaving out the Re grade (referred to as Ag grade) in the first half of the table. No concentrate qualities are provided, which is important to derive actual payability and off-mine costs. Fortunately Table 22-5 in the Economic Assessment section provides some of the missing information.
Crux Investor has used the spot metal price on 5 August 2025: US$4.38/lb Cu, US$3,372/oz Au, US$23.80/lb Mo and US$3,690/kg Re. For payability a rate of 96.5% was assumes subject to a minimum deduction on one percentage point of the concentrate grade, for Au in concentrate 96.5% was used subject to a minimum deduction on 1 g/t Au in concentrate, 99% payability for Mo and 80% for Re. For realistic treatment charges reference was made to a technical report dated September 2024 relating to the Thompson Creek molybdenum project. Treatment charges of US$323/t concentrate are used and refining charges of US$0.55/lb payable Mo for total treatment charges of US$37 million over the life of the project.
Production Schedule
Figure 2.6.2_1 shows at the top the mine production schedule with relatively high waste strip ratio in the early year before mining at Hushamu starts, but with much higher feed grade (expressed as NSR value) as shown in the plant production schedule.
Crux Investor has adopted these schedules, but used the recoveries derived in Table 2.5.1_1.
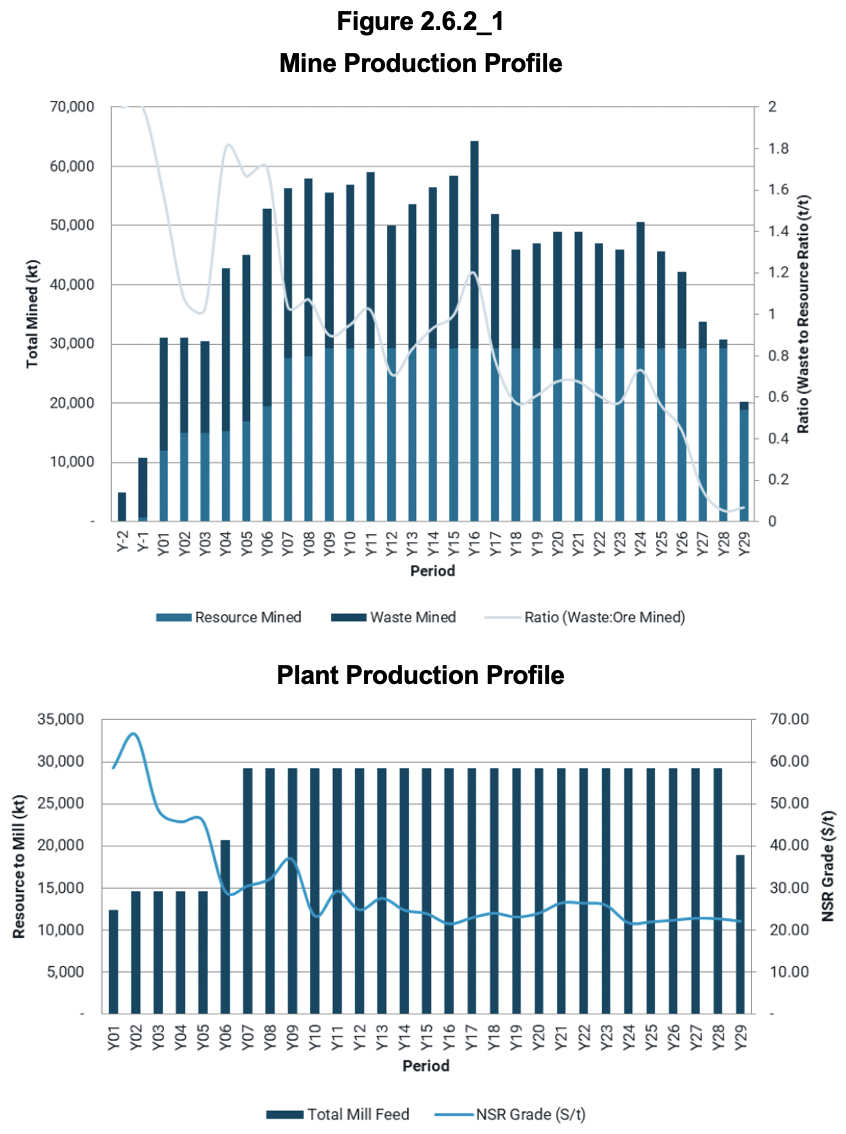
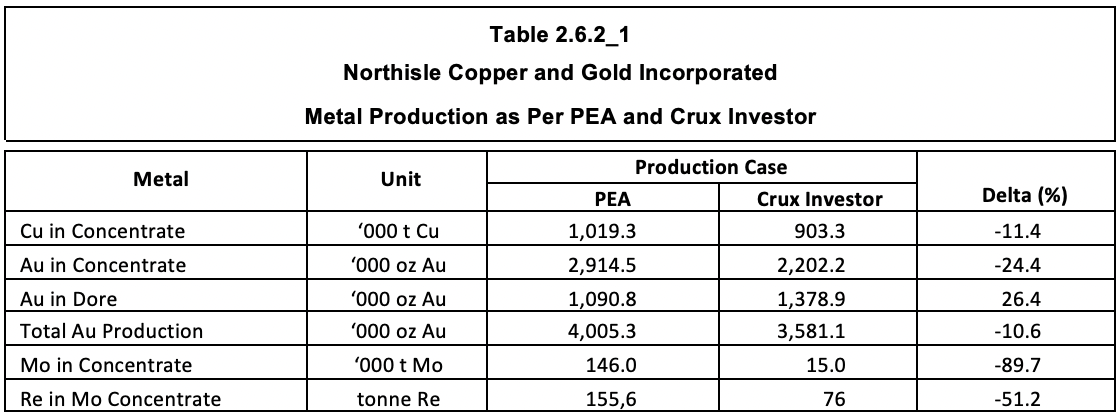
Table 2.6.2_1 shows the differences between metal production as per PEA and the Crux Investor model.
The table demonstrates that both copper and gold production are forecast to be approximately 11% lower, but Mo and Re production will be a fraction of what is forecast in the PEA.
Capital Expenditure
Table 2.6.3_1 shows the capital cost estimates for initial construction, expansion capital and sustaining capital. The PEA gives the numbers in Canadian Dollars, but Crux Investor has converted these to US Dollar using the PEA exchange rate of US$0.76 per Canadian Dollar. Once converted the provisions look a lot less impressive.
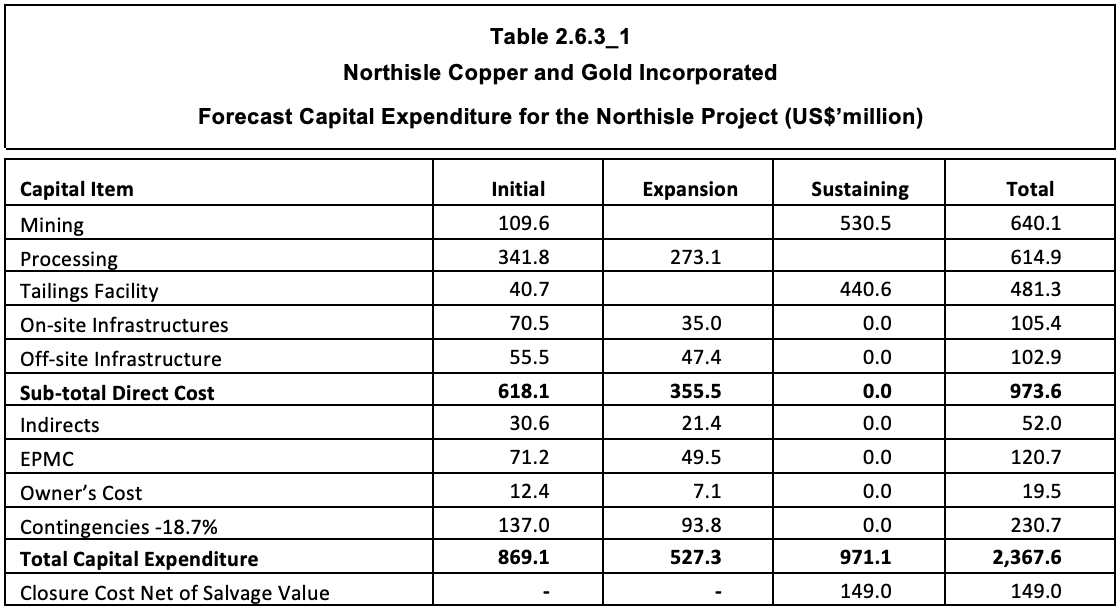
The capital provisions for the processing plant amount to US$281/monthly tonne capacity for the initial plant and US$224/monthly tonne for the expansion. These provisions are far too low, probably by a factor 2. This is in particular so as the plant will comprise not only a crushing/milling and flotation circuit, but also a cyanide leaching section to produce gold in doré. Crux Investor has doubled the provisions for processing plant.
The EPCM amounts convert to a rate of 11.5% and 13.9% of direct cost which is very low compared to conventional rates. These rates have however been used against the amended provisions.
The infrastructure provisions also look low for the size of operation, but without local insight Crux Investor has accepted the numbers.
The contingency amounts to only 18.7% of the sub total before the contingency. For a PEA level study this is too low and has been raised to 25% by Crux Investor, and also applied to sustaining capex.
Operating Expenditure
Table 2.6.4_1 presents the estimated operating cost as per PEA, again converted to US Dollar, but with costs comparison to other projects or mines. According to the PEA the costs were estimated based on first principles. The problem with first principles estimation is that it by definition is always too low. You can only estimate items and activities that are considered, failing to include those overlooked. In addition, such estimations assume perfect execution. For these reasons, first principles estimations should be checked against benchmarked numbers of similar operations.
However, it is very difficult to find Canadian companies disclosing their unit operating costs and, except for Mount Milligan, reference had to be made to technical reports on Thompson Creek (dated 1 September 2024) and Detour Lake (dated 20 September 2024) for such numbers. Being technical reports, they will tend to suffer from the same first principles estimation approach.
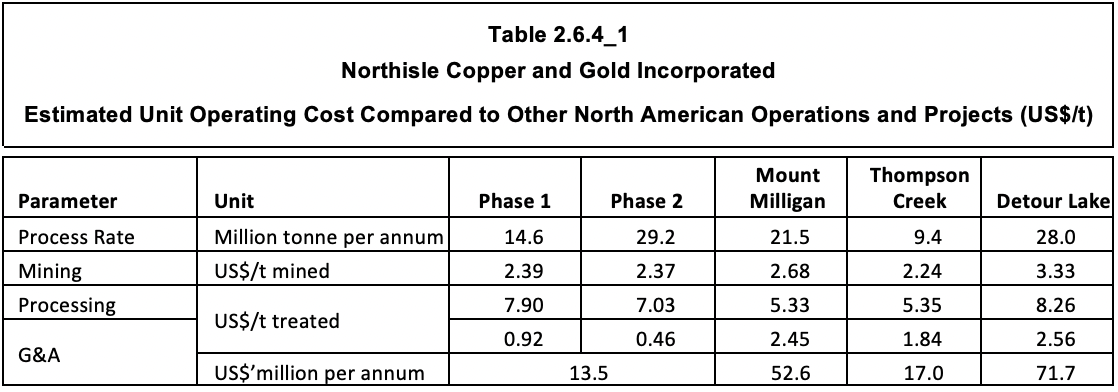
From the table above it is evident that only Thompson Creek has lower provisions for mining and processing, but it also has a much simpler process route focused on producing only a Mo concentrate. Primary grinding is to a much coarser P80 minus 212 microns and regrinding of bulk concentrate to P80 minus 45 microns. As the ore contains less than 1% pyrite, much less bulk concentrate will need regrinding than for the North Island project and pyrite separation is much less onerous.
From the above Crux Investor concludes that the suggested cost structure for North Island project is much too low. It has included in its model US$2.7/t for mining cost, US$8.0/t for processing and G&A of U$50 million per annum.
Royalties and Taxes
There is only a royalty of 3% on Red Dog production, of which Crux Investor assumes 2% point will be acquired for C$2.0 million. In addition “on portions of the Hushamu deposit” a 10% net profit interest (“NPI”) royalty applies. There is not much one can do with this “information”. How the NPI will be calculated is not defined and what production years are affected and to what degree is not disclosed. Crux Investor assumed that no depreciation/amortisation will be part of this calculation. The total LOM royalty in the PEA amounts to C$597 million, which is 4.6% of EBITDA. The Crux Investor model recreated the same percentage overall royalty.
As usual, the technical report gives virtually no information about how taxes were derived, one of the largest cash outflows in the cash flow model and important for the calculation of the net present value (“NPV”). The only two pieces of information are the overall effective tax rate over the life of mine of 38.2%, comprised of 24.9% for income tax and 13.3% for British Columbia mining tax and the amount involved: C$3.88 billion, or US$2.95 billion.
The latest published report on the method of calculating taxes for mining companies is by Price Waterhouse Cooper (“PWC”) dated 2016. Apparently since then auditing firms prefer parties to consult them directly. According to this document, at the time applicable taxes for mining companies in British Columbia were:
- British Mining Tax – two tier system based on “net revenue”;
- Federal Corporate Income Tax at 15.0%;
- British Columbia General Corporate Tax another 12.0%.
The British Columbian Mining Tax is levied in two stages: a 2% tax on “net current proceeds” and 13% tax on “net revenue”. The net current proceeds tax is a form of minimum tax, which is deducted in full, with an interest component, against the 13% net revenue tax.
The net current proceeds are defined as gross revenue (including forward sales, but ignoring hedging gains and losses) minus operating expenses and post-production development cost. With the exclusion of deductions for financing cost, capital expenditure and pre-production expenses, the effect is that taxes will be payable as from start of production.
The net proceeds tax is creditable against the 13% net revenue tax with a notional interest of 125% of the prevailing federal bank rate (at the time of the PWC report 3.75%).
The 13% net revenue tax base is derived by deduction from net proceeds sustaining capital expenditure, exploration costs and pre-production development costs.
With respect to Corporate Income Taxes, the tax base for Federal and British Columbian Provincial taxes should be calculated on the same basis: Earnings before Tax and Depreciation minus British Columbian Mining Taxes.
Interest is allowed as a deduction as well as amortization/depreciation which has the following components:
- Canadian Capital Allowance (“CCA”) – covering capital assets purchased, distinguished in assets purchased before start of commercial operation. These are allowed at 25% per annum on a declining balance basis. In recognition to the fact that assets are acquired throughout the year, only half the additions are eligible in the base to which the CCA is applied.
- Canadian Development Expense (“CDE”) - the acquisition cost of a Canadian mining property and associated mine development expenses, both initial and sustaining capital expenditure (exploration, studies, shaft, underground development) – 30% pa.
The PEA document does not give information of available balances for CCA and CDE. The annual financial statement for the year ending December 2024 includes the following statement: “Deferred tax assets have not been recognized as it is uncertain that the Company will have future taxable income against which they could be utilized”. Crux Investor could therefore not include such in its calculations.
Results
Table 2.6.6_1 summarises the LOM results and included certain amounts as per PEA model for comparison. It should be noted that the PEA presents its economic model chaotically and not in the logical format of Table 2.6.6_1 and the PEA numbers do not result in the net free cash flow figure.
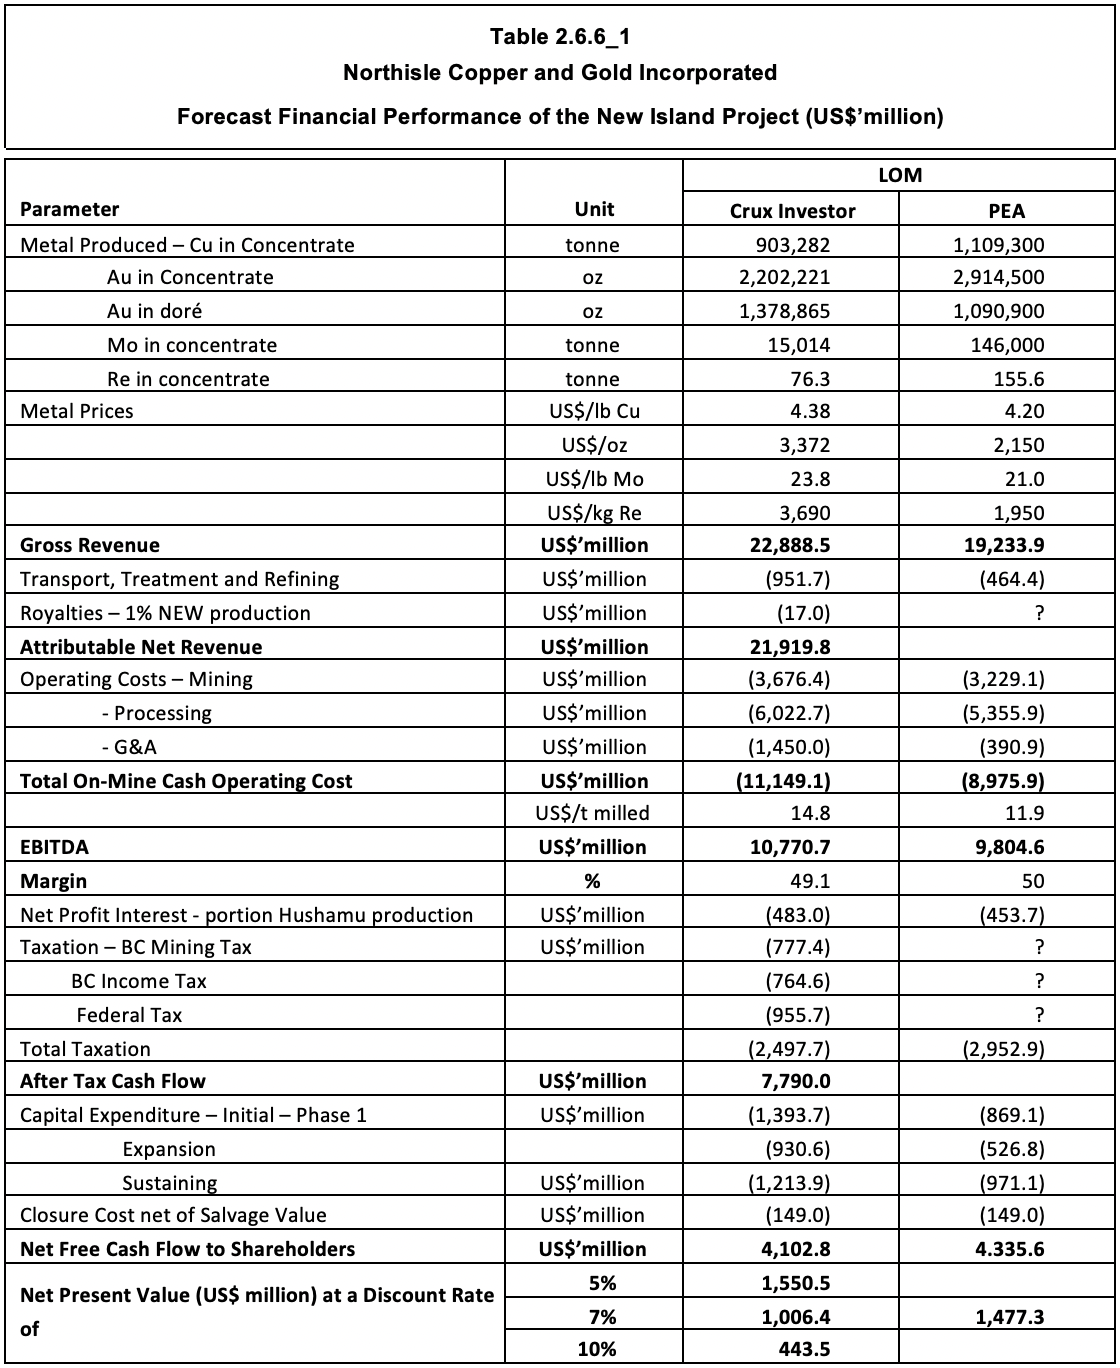
The table illustrates that, despite much lower metal production, gross revenue is much higher than for the PEA thanks to higher spot prices, in particular the gold price. However, with adjustments to the operating costs the operating profit is only 10% higher. Somewhat surprisingly, the total tax amount is lower than arrived at by the PEA and constitutes an effective rate of 23.2% due to tax allowances for capital expenditure.
After adjustments to capital expenditure which are in total 47% higher than that in the PEA, Crux Investor arrives at US$4,103 million net free cash flow compared to US$4,335 million in the PEA. Surprisingly, the difference in NPV7 is much higher than the difference in net free cash flow, probably because Crux Investor does not discount negative cash flows during the pre-production period as these funds are raised upfront and do not earn 7% real return. The NPV7 amount of US$1,006 million amounts to 72% of initial capital expenditure. This drops to 57% when discounting at 8%, which Crux Investor considers more appropriate for modelling cash flow of a project.
This is only part of the story. With the considerable outlay involved for the expansion, the payback period is actually very long: 6.5 years as is evident in Figure 2.6.6_1.
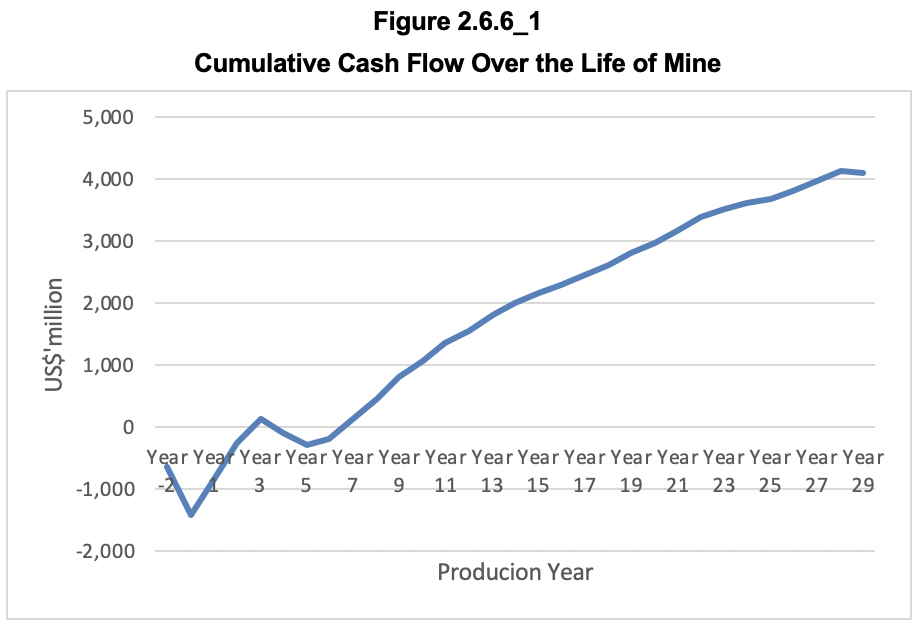
Table 2.6.6_2 expresses the sensitivity of the value of the project as the change in NPV’s per percentage point change in the main parameters: metal prices, operating expenditure, and capital expenditure.
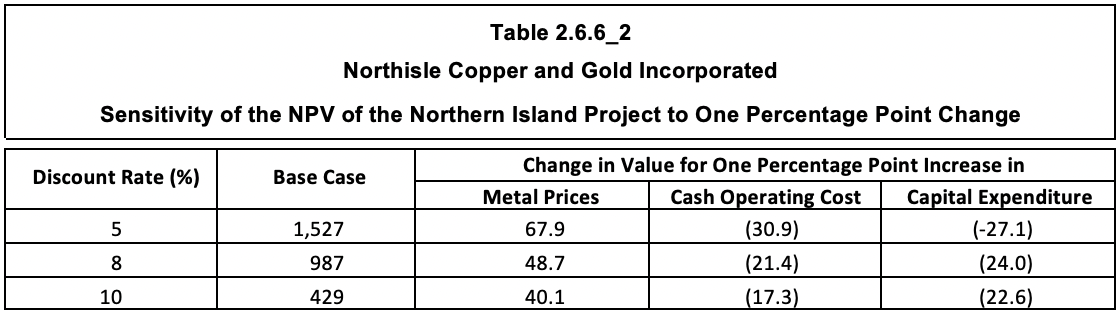
The sensitivity analysis demonstrates the marginal nature of the Northern Island project with the NPV8 increasing by 6.2% (US$48.7 million) for every percentage point increase in the metal prices and dropping by only 2.7% (US$21.4 million) for every percentage point increase in operating cost (i.e. US$0.15/t processed). Given the size of capital expenditure required, the NPV8 is relatively sensitive to changes in this parameter, changing 3.0% for every percentage point increase (i.e. US$37 million).
Developments Since The PEA
As is evident from Figure 1_1 whereas the findings of the PEA were well received, the share price increased sharply after 16 May 2025, well after their release. It is therefore appropriate to review the news releases thereafter to determine whether there have been further important developments.
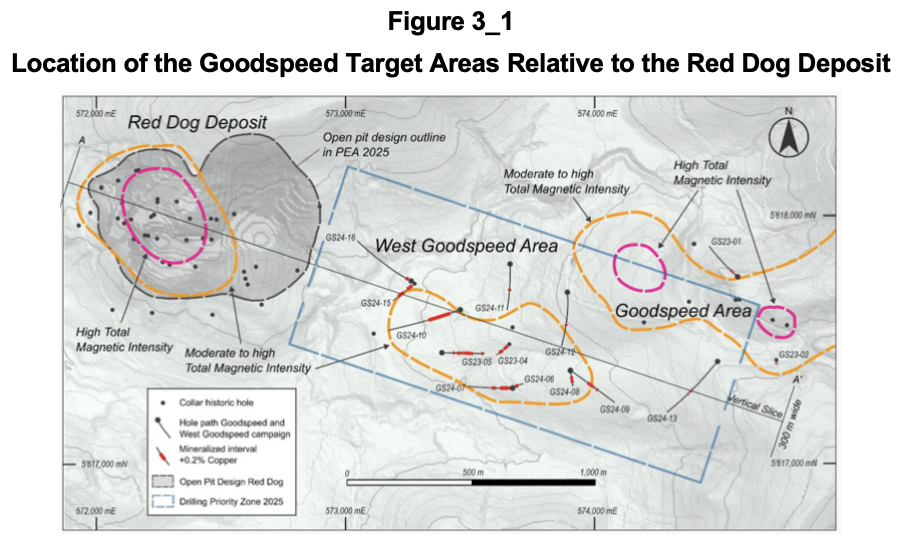
On 28 April 2025 the company announced commencement of drilling at West Goodspeed and that NWE would also get attention “on identifying the intrusive associated with high-grade gold mineralization in this segment of the belt”. Figure 3_1 shows the location of the Goodspeed target areas in relation to the Red Dog deposit.
On 12 May 2025 Northisle started trading on the OTCQX market, which is just before the sharp increase in its share price.
On 2 July the results for the first four holes were released, reproduced in Table 3_1 with the weighted average grades compared to the overall declared resource grade for the North Island project.
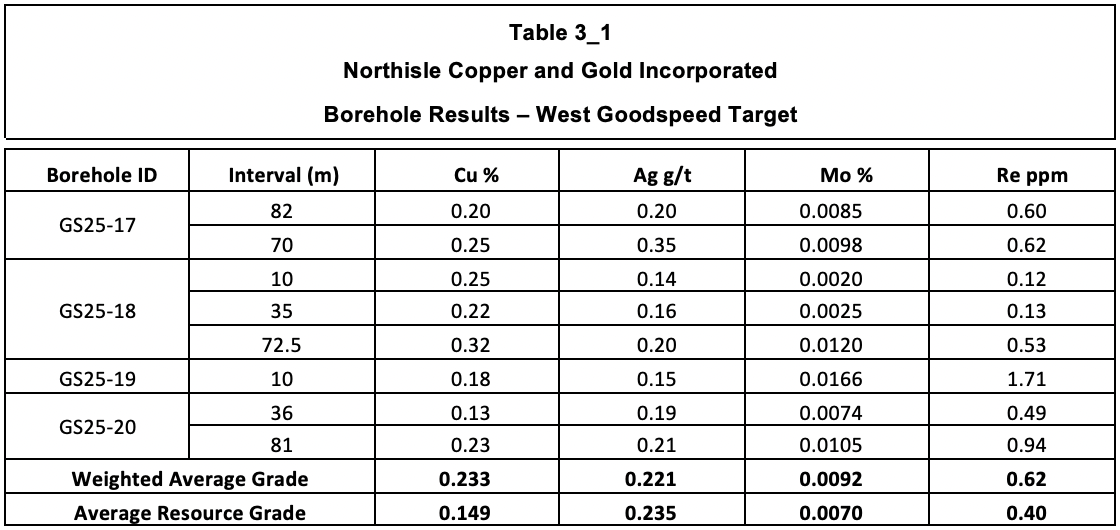
The table shows that all holes have wide intervals with relatively good grades compared to the overall declared resource grade for the North Island project and the weighted average copper grades clearly exceed the copper resource grade. These results will have encouraged the market.
On 16 July 2025 the company announced its intention to raise C$25 million together with the advice that another C$5 million would be raised through a non-brokered private placement of shares with Wheaton Precious Metals Corporation (“Wheaton’). Only one day later another press release announced that the brokered placement had been increased from C$25 million to C$30 million ”as a result of strong investor demand”.
The above developments indicate that the market appreciates the recent exploration results and the plans of the company to add higher grade resources close to the higher-grade components, Red Dog and NWE, of the current resources. An endorsement from a major company such as Wheaton must also be seen as very positive.
The Enterprise Value of Northisle Copper and Gold on 5 August 2025
At the share price of C$1.34 on 5 August 2025, the market capitalisation for the 258.1 million shares is C$346 million, or US$251 million.
On 31 March 2025, the company had no warrants outstanding, but 9.8 million share options, which were all in the money at an average price of C$0.33. Another 2.6 million restricted share units and deferred share units were outstanding.
On 31 March 2025 the net current assets amounted to US$5.7 million. On 14 April there was a small private placement raising of C$0.175 million.
Based on the above an Enterprise Value on a diluted basis for Northisle of C$353 million (US$256 million) is derived as shown in Table 4_1.
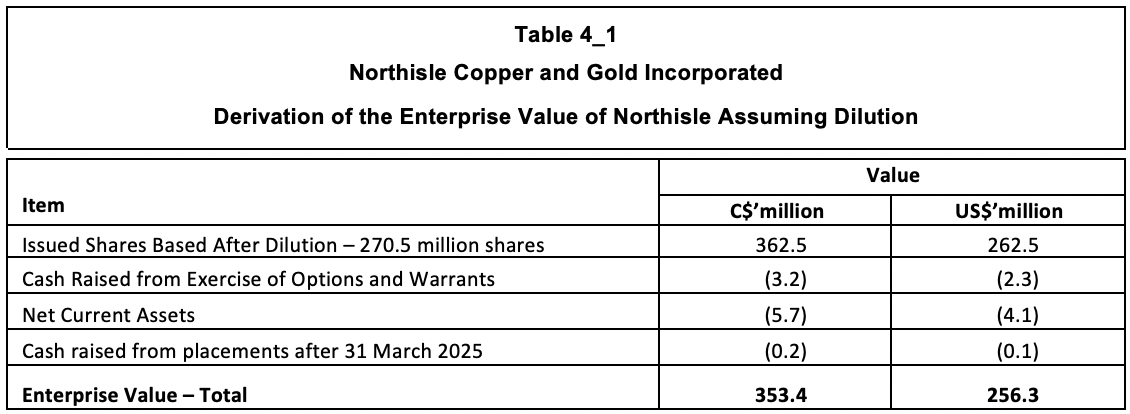
The Enterprise Value is less than one third the NPV8 value calculated by Crux Investor.
Another metric to put the Enterprise Value in perspective is to express this as value per Au equivalent ounce in resources. Based on the relative contribution to overall revenue in the Crux Investor cash flow model, the other metals roughly double revenue. This implies that the declared resources contain 16.7 Moz AuEq metal, which converts the Enterprise Value to US$15/oz AuEq. Such a value is equal to 0.5% of the spot gold price. This makes the sudden interest in Northisle understandable.
Executive Summary
Northisle Copper and Gold Incorporated (“Northisle”) (TSXV:NCX) is a Canadian company that is advancing the North Island gold project on northern Vancouver Island in British Columbia, Canada. This project has a very long exploration history, but despite finding considerable mineral resources, it has yet to be developed into a mining operation. The explanation lies in the very low overall grade of the deposits.
However, the share price has come alive lately, and Crux Investor decided it should take a closer look.
The latest technical milestone reached by the Northern Island project is the release of a preliminary economic assessment (“PEA”) dated 12 February 2025, the document on which this valuation is based. The resources that have been defined are within three deposits: Hushamu, Red Dog, and Northwest Expo (“NWE”). The mineralisation contains Cu-Au-Mo and some Re and is emplaced within the upper reaches of porphyry systems. The intensity of mineralisation and metal zonation is strongly associated with the type of alteration around the porphyry systems. Northwest-trending thrust faults are the primary control on the emplacement of mineralising porphyry bodies. Hushamu is by far the most important deposit in terms of mineral resources. It, however, is also the lowest grade deposit. The business plan in the PEA converts roughly 75% of the metal contained in total resources into plant feed at grades that are roughly 12% higher. Of the mineable inventory (= the plant feed over the life of mine) Hushamu accounts for 87% of the contained Cu and 76% of the Au. The grades are, however, very low at 0.17% Cu and 0.26 g/t Au. The credits from Mo (at 0.009%) and Re (0.45 ppm) help sweeten things.
At such grades, a project needs some favourable aspects. Jurisdiction is excellent, the location close to several harbour options will be a great help, a very low stripping ratio of 0.83 is a great advantage, and the bulk nature of the deposit will allow for the deployment of very large equipment and a high annual throughput for economies of scale. However, what has really made a difference lately is a sharp rise in the gold price.
In addition to the above, the business plan envisages a first phase of operation for the initial five years, when the higher-grade Red Dog and NEW deposits are planned to be mined. After this phase, production is planned to double plant throughput upon the start of operations at Hushamu. Such a phased approach reduces the upfront funding requirement.
The PEA further reduces upfront funding requirements by including optimistic capital provisions, especially for the process plant. At US$281/monthly tonne capacity for the initial plant and US$224/monthly tonne for the expansion module, the provision is probably half what is required. This is in particular because the plant will comprise a crushing/milling and flotation circuit and a cyanide leaching section to produce gold in doré. The contingency in the capital estimate amounts to only 18.7% of the sub-total before the contingency. For a PEA level study, this is too low and has been raised to 25% by Crux Investor and also applied to sustaining capex.
As is usual with technical reports that fail to benchmark their operating cost estimates with actual cost of similar operations, the unit cost provisions were found to be too low. With three other operations as a comparison, Crux Investor amendments resulted in an overall increase of 24% in cost per tonne milled to US$14.8.
Another way in which the PEA helped to arrive at a positive conclusion was metallurgical performance based on unrepresentative high-grade composites used for the testwork. Crux Investor has used scatter plots in this review to demonstrate how the testwork results are unrepresentative compared to the mineable inventory grades. Based on the scattergrams, the Crux Investor model includes distinctly less favourable metallurgical performance parameters. These resulted in Cu and Au production being around 11% lower in the Crux Investor model, with Mo especially much affected, being 90% lower and Re 51% lower.
Despite the interventions by Crux Investor stressing the input parameters, the evaluation arrives at a NPV7 of US$0.99 billion compared to the C$1.48 billion in the PEA. However, with the phased approach, the project's payback period is 6.5 years on an undiscounted basis. Crux Investor deems 8% to be a more appropriate discount rate for a project than 7% suggested by Northisle. At a ratio of NPV8 / Initial Capex equal to 0.57 this is still a decent result.
The results are still decent because of the very forgiving rise in metal prices, especially gold. The spot price of US$3,372 used in the Crux Investor valuation is 57% higher than the gold price of US$2,150/oz assumed in the PEA. At this level, gold accounts for more than half the project's gross revenue.
The PEA results were well-received, based on the rise in share price after the announcement. However, the share price was really propelled upwards after 20 May 2025. The listing on the OTCQX market may have something to do with it, but more likely endorsement of management strategy to add higher-grade resources in the Red Dog and NWE areas and initial encouraging drilling results there. Moreover, the Wheaton Precious Metals Corporation (“Wheaton”) decision to support a share placement of C$5 million is a vote of confidence from a reputable industry insider.
Crux Investor calculates a diluted Enterprise Value of US$256 million, effective 5 August 2025. This amounts to US$15/oz AuEq in total mineral resources. At 0.5% of the gold price, this is a low valuation and may have been the reason for attracting such good funding support. Not much needs to happen to improve the economics further. Examples are success in adding higher grade resource near Red Dog and NWE and proving through metallurgical testwork that at mineable inventory grade, the recoveries in the PEA really do apply and that molybdenum and rhenium can successfully be separated in a clean concentrate at high recoveries.
As pointed out in the previous Analyst’s Notes (on Newcore Gold) a company is usually valued at 0.2-0.3x the NPV8 value of a PEA, which would make the value of Northisle around US$237 million, slightly less than its current value. However, Crux Investor has stressed inputs to the cash flow model and included many conservative assumptions, something other market analysts will probably not do. Crux Investor is realistic enough to understand its influence and that others will rate the company more generously. They will push a re-rating by accepting the PEA inputs and pointing to much higher metal prices than assumed by the PEA. Table 22-8 of the technical report points to a post-tax NPV8 of US$3.34 billion at “spot metal prices”, which is 92% higher than the NPV8 of the PEA base case. Perceptions count more than realistic assumptions for a share’s prospects.
In conclusion, Northisle Copper and Gold is a good investment opportunity, provided the current high gold price is maintained in the long run.
Introduction
Northisle Copper and Gold Incorporated (“Northisle”) (TSX:NCX) is a Canadian company that is advancing the North Island project in British Columbia, Canada.
The project is situated between 15 km and 40 km southwest of Port Hardy on northern Vancouver Island and contains the Hushamu, Red Dog and Northwest Expo deposits and multiple other partially explored copper-gold porphyry occurrences. The tenements cover a west-northwest trending 40 km x 8 km area. The company’s first involvement dates back to 2011 with numerous other parties having been involved since the 1960’s. The reason why the history goes this far back without mine development is the very low-grade nature of the drilled deposits. Lately however, the share price has come alive as is shown in Figure 1_1, which gives the price performance on the TSX over the last five years.
The sudden price explosion has piqued the interest of Crux Investor to look deeper into company’s prospects.
Valuation of the North island Project
Background
The information in Section 2.1 to Section 2.6.5 of this report are derived from a NI.43-101 compliant technical report dated 12 February 2025 reporting on the findings of a PEA and authored by Ausenco. Any amendments by Crux Investor will be clearly signalled.
The North Island project covers a west-northwest-trending 40 km x 8 km area north of the Holberg Inlet, 25 km west of Port Hardy, on northern Vancouver Island, B.C. (see Figure 2.1_1).
The deposits indicated in orange on the map comprising the project can be accessed from Port Hardy by a paved road to Coal Harbour at the East of the tenement area and then via well-maintained logging roads.
The tenement area is 342 km2 large consisting of a contiguous block of 214 claims, being 140 contiguous modern claims in yellow in Figure 2.1_2 and 74 smaller pre-1970 claims (in brown), which largely overlap modern claims in the areas surrounding the Hushamu and Red Dog deposits.
A portion of the claims underlying the project (historically known as the Expo claims) are subject to a 10% net profit royalty now owned indirectly by Royal Gold, Inc., and a C$1 million cash payment is payable to Sirit Incorporated. Certain other claims (historically known as Apple Bay claims) require a C$0.8 million payment (in cash or shares) to be made to Electra Gold Ltd. in the event of a production decision on those claims. The 16 claims that comprise the Red Dog property are subject to a 3% Net Smelter Returns (“NSR”) royalty, of which 2% can be repurchased for C$2.0 million. For the location of the mentioned deposits refer again to Figure 2.1_1.
The Northern Island project has been around for a very long time with exploration and drilling dating back to 1965. Northisle got involved as far back as 2011. The company executed drilling programmes in 2012, 2014, 2017 and 2021-2022. The project was obviously a hard nut to crack.
Geology and Mineralisation
The Hushamu, Red Dog, and Northwest Expo deposits host Cu-Au-Mo-Re mineralisation within the upper reaches of porphyry systems. Mineralisation is hosted within the intrusive rocks and/or the host rocks and consists of quartz stockworks, veinlets, disseminations and replacements within large hydrothermally altered systems. Intensity of mineralisation and metal zonation is strongly associated with the type of alteration around the porphyry systems. Northwest-trending thrust faults are the primary control on the emplacement of mineralising porphyry bodies.
Hushamu is by far the most important deposit in terms of mineral resources. The mineralized zone here extends 2,500 m in a NW-SE direction, dips 25 degrees north, extends 860 m down dip and has an average thickness of 380 m. Three alteration zones are recognised: the Leached Zone (“LEA”), The silica-clay-pyrite (“SCP”) alteration zone and the chlorite-magnetite (“CMG”) zone.
The LEA alteration zone occurs at the upper part of the Hushamu lithocap SCP alteration. This leached zone of SCP (in blue in the NS cross section in Figure 2.2_1), ranges from 50 m to 200 m thick, in which there is no significant copper or gold.
The silica-clay-pyrite (“SCP”) alteration zone (in yellow in Figure 2.2_1) is below the Leached Zone and contains 10%-20% pyrite, the copper mineralisation occurs as blebby and vein chalcopyrite (CuFeS2) and lesser bornite (Cu5FeS4) and the highest molybdenite (MoS2) and rhenium concentrations of the three alteration zones. CMG alteration (in red in Figure 2.2_1) underlies the SCP alteration. In this zone copper mineralisation is highest.
The Northwest Expo deposit (“NWE”) comprises a semi-tabular body that extends over 730 m in the NW-SE direction, over 400 m downdip and averages 120 m thick. Similar to the Hushamu deposit, at NWE there are SCP, CMG, and chlorite-zeolite-carbonate (“CZC”) (recorded as propylitic at Hushamu) alteration domains. A generalised section is shown in Figure 2.2_2.
SCP1 (in bright yellow) is above the CMG (in red) and SCP2 (dirty yellow) below the CMG alteration. The SCP1 and SCP2 alteration envelope essentially forms the boundary within which the resource has been modelled. Within SCP pyrite comprises 10%–20% of the rock. The CMG alteration is analogous to CMG at the Hushamu deposit and identical in appearance. SCP1 at its upper levels has background to low copper-gold-molybdenum-rhenium assay grades. Towards the basal 50 m of the contact between SCP1 and CMG the gold grade becomes generally significant (>0.1g/t Au) along with molybdenum (>250 ppm Mo) and associated rhenium (>0.5 ppm Re) grades. This increases down to the contact and diminishes progressing down through the CMG alteration. Conversely, copper grades are mostly low to background in SCP and generally increase abruptly at the SCP1 / CMG contact. In CMG copper mineralisation occurs as disseminated chalcopyrite and minor bornite and chalcocite (Cu2S) associated with hydrothermal magnetite. The gold grades at NWE are significantly higher than Red Dog and Hushamu.
The Red Dog deposit is centered on a Quartz-Magnetite Breccia (“QMB”) which forms a 350 m x 150 m west-northwest trending body between major ENE-trending faults. Six alteration types have been recognised in the Red Dog area of which two are important for mineralisation: quartz-magnetite breccia (“QMB”) indicated in purple on the map in Figure 2.2_3, and Intermediate Argillic Alteration (“CMG”) in light brown on the map. The resource outline is indicated as an interrupted red line.
Together with mineralisation in CMG the Red Dog deposit extends 730 m NW-SE by 400 m width and 120 m thickness, but occurring predominantly in the QMB.
In conclusion mineralisation and metal grades are dominantly determined by the type of alteration and the best metal grades are not coincident. Better Mo and Re grades are unfortunately generally not associated with better copper and gold grades.
Mineral Resources and Mineral Reserves
Mineral Resources
The discussion in the PEA on how the mineral resources were derived is very brief.
At each deposit, three-dimensional solids have been created of the alteration/lithologies to aid in the orientation and extent of the mineralised domains. Figure 2.3.1_1 shows such solids for Hushamu and Red Dog as examples.
The selection of capping levels for the various metals for the various deposits was based on cumulative probability plots before compositing. Capping results in minimal changes in the average grade. The coefficients of variation (“CV’s”) are around 1.0, even for gold, which is impressively low. A composite length of 3 m was chosen with boundary bordered being honoured. Correlograms have been created for each domain, and each deposit. The presented graphs for the semi-variograms all look very well defined.
The chosen block size for NWE and Red Dog is 10 m x 10 m x 10 m and 20 m x 20 m x 15 m for Hushamu, reflecting the bulk nature of the mineralisation. Block grade estimation of Au, Cu, Mo and rhenium values was done by ordinary kriging (“OK”). According to the technical report visual verification includes a series of E-W and N-S sections every 20 m through the block models and plans at 10 m intervals. Figure 2.3.1_2 includes two examples of such cross sections.
The correlation between block grade and borehole assays looks reasonable except for the higher Au grades at the bottom of the pit outline not obviously supported by borehole results. This could however be supported on a parallel section.
Table 2.3.1_1 gives the mineral resource statement, effective 23 September 2024, authored by Moose Mountain Technical Services (“MMTS”).
The table shows that the resource grades are very low and must have been estimated using very favourable economic inputs to drop the cut-off grade to a very low level.
Of the resources 81% of the tonnage has been classified as Indicated with 84% of the contained copper and 82% of the contained gold in this category. This usually a high enough proportion to consider completing a feasibility study. However, the confidence level of completed studies is generally too low for such a study. Hence the PEA.
Mineable Inventory
Drafting a PEA allows for Inferred resources to be included in the business plan. The total material in such a plan can be referred to as Mineable Inventory.
The pit optimisation uses undiscounted cash flow which down plays the importance of the economic impact of early stripping. This is very much compensated by assuming a low gold price of US$1,910/oz, which in turn is compensated by assuming far too low unit operating cost, which will be discussed in Section 2.6 4 of this report.
The conversion of resources to mineable inventory accounts for the dilution in the block grade by using a large block size for the resource estimation. On top of this 4% dilution is estimated to result from mining beyond the edges of mineralised blocks. Table 2.3.2_1 shows the declared Mineable Inventory.
The table illustrates that Hushamu is by far the largest deposit, but also having the lowest grades. That is why the company plans to mine NWE and Red Dog in the early years (Phase 1 covering the first five years) followed by Phase 2 with treating Hushamu material at double the throughput rate of Phase 1.
Comparison between Mineral Resources and Mineable Inventory indicates that approximately 75% of the contained metal is converted to plant feed at a grade that is 11% - 14% higher, despite the assumed 4% dilution.
Mining Operations
The plan is to mine the deposits by conventional open pit operation, based on large scale conventional drill/blast/load/haul mining methods and as owner operator. With production starting at Red Dog, the primary crusher is planned there with crusher ore planned to be conveyed to Hushamu in due course. This means that a considerable proportion of ore needs rehandling from the stockpile at Hushamu to feed the plant there. Figure 2.4_1 shows the mine layout at Red Dog and NWE at the top and at Hushamu at the bottom.
Topsoil, overburden, and non-acid generating (“NAG”) and potentially acid generating (“PAG”) waste rock mined from the open pits will be hauled to ex-pit storage facilities. This means that a measure of grade control (i.e. requiring analysis for sulphur and calcium) is required to identify and keep NAG and PAG waste separate. PAG waste rock mined from the Hushamu pits is planned to be deposited sub-aqueously within the tailings dam facility. Overburden will be stockpiled for when mine closure requires return of this. The PEA estimates that 74% of the waste mined will be PAG. Such a large proportion can be expected to present problems for disposal, especially when the start-up at Hushamu involves substantial pre-stripping.
In conclusion, material handling involved with mining will be substantial and add to the mining cost.
Metallurgy and Processing Operations
Metallurgical Test Work
According to the technical report seven metallurgical programs have been carried out dating back to 1989 and including “in progress 2024”. It should be noted that no press releases relating to the 2024 testwork have been issued. Crux Investor takes this as an indicator that no material changes have occurred since the publication of the PEA report.
Of the seven programs two only tested for rougher flotation, which is only one step in the planned process. The process involves a conventional copper flotation flowsheet designed to recover all sulfides into the rougher concentrate, followed by regrinding and flotation cleaner stages. Selective pulp chemistry conditions and fine regrinding were required in the cleaner circuits to reject pyrite and produce marketable copper concentrates. Regrinding of the rougher concentrates is to P80 minus 20 microns. Given the amount of pyrite in the feed relatively much material will need regrinding.
Comminution tests indicated that the mineralisation at the various deposits is moderately soft with respect to semi-autogenous grinding (“SAG”) milling, but moderately hard with respect to ball milling. Hushamu SCP material has average abrasiveness, while the other zones are rated less abrasive.
Much of the discussion deals with rougher flotation results, but somehow the conclusion on final metal recoveries includes leaps of faith with respect to Mo and Re recovery. To quote:
It is proposed that bulk copper concentrate generated from Hushamu material would be processed through a Cu-Mo separation circuit to recover a molybdenum concentrate. No Cu-Mo separation circuit testing has been completed to demonstrate the metallurgical performance of this process, however Mo recovery of 90% across the circuit has been estimated as a reasonable industry standard for porphyry Cu-Mo deposits. Rhenium is expected to be associated with molybdenite, therefore rhenium recovery to the final Mo concentrate is expected match molybdenum recovery. An additional 90% factor is applied to the final rhenium recovery to reflect unforeseen processing losses.
As can be seen the suggested performance is not based on actual testwork and totally speculative. To refer to “industry standard” is not appropriate for a deposit that is much lower grade than “industry standard” and has a much higher pyrite content.
What stands out from the testwork is that composites were used that have unrepresentatively high grades compared to the mineral resource grade. Crux Investor has generated scattergrams to determine whether there is a relationship between feed grade and recovery and found this clearly to be the case. Figure 2.5.1_1 shows the relationship for Cu from the Hushamu mineralisation.
The diagram shows a close relationship for four composites of CMG mineralisation and four samples (one results is covered by a CMG result) of SCP. The arrow has been added to illustrate that all composites used have clearly higher copper grades than the average mineable inventory grade. It indicates that a Cu recovery of 70% should be applied over the life of mine (“LOM”), not the 77%-81% suggested in the PEA.
Figure 2.5.1_2 shows the same relationship, but for SCP and CMG mineralisation at NWE and for Red Dog (grey dots). Again much higher-grade composites were used for the testwork than the average grade of the mineable inventories for these deposits. For the PEA a recovery of 70% should be used for the NWE deposit and 80% (at best!) for Red Dog.
The same pattern is seen for gold recovery versus feed grade at Hushamu and the other deposits, refer to Figure 2.5.1_3 and Figure 2.5.1_4.
The relationships above imply that a gold recovery into Cu concentrate of 25% should be used for SCP and 40% for CMG.
The relationships above imply that a gold recovery into Cu concentrate of 30% should be used for Red Dog and 45% for CMG at NWE and 60% for SCP at NWE.
Figure 2.5.1_5 shows the relationship for Mo at Hushamu (the other deposits do not have Mo of economic interest).
Implied from the graph above is that the Mo recovery is very grade sensitive for SCP and insensitive for CMG. The recovery at mineable inventory grade should be respectively 15% and 50%.
To enhance gold recovery, cyanide leaching of the pyrite-rich cleaner tailings was investigated, as well as rougher tailings generated from NWE and Red Dog materials. For Hushamu recoveries between 45% and 53% were reported from the cleaner tailings and between 75% and 80% from leaching the rougher tailings from the other deposits. Unfortunately no information was provided about the feed grade to determine whether these are representative. However the graphs in Figure 2.5.1_6 were provided for leaching variability samples from NWE.
The graphs make no sense at all. It is impossible for the feed grades to exceed the feed grade to the flotation circuit as many ounces are captured in a small amount of copper concentrate, leaving less ounces for almost the same amounts of tailings as the tonnage fed. Based on an indicated mass pull to Cu concentrate of around 1% in the plant design, the cleaner tailings grades would be between 0.05 g/t Au and 0.13 g/t Au, which are a fraction from what is shown above.
Based on the above, Crux Investor would caution the reader to accept the suggested recoveries and has generated its own numbers. Table 2.5.1_1 reproduces the recoveries suggested in the PEA for the various metals at the various deposits and their types of mineralisation, below which Crux Investor has made the same calculation but with inputs that have been amended based on the above graphs (cells indicated by a blue colour).
The way to read the table is that the final overall Cu recovery is the same as recovery to Cu concentrate. The Mo recovery is the recovery to the Cu concentrate times the recovery to Mo concentrate (90% as per PEA, 80% as per Crux Investor). Please note that both numbers are pure guesstimates. The Re recovery is the Mo recovery times 90%, again a pure guesstimate with no testwork completed to substantiate it.
The gold recovery is the sum of recovery to Cu concentrate plus the leaching recovery of gold in the cleaner tailings for Hushamu and this total plus the leaching recovery for rougher concentrates for NWE and Red Dog. Please note that, despite misgivings, Crux Investor has assumed the same proportion of gold reporting to rougher tailings which results in a different proportion reporting to cleaner tailings (the sum of all needs to be 100%). The overall results are a downgrading of all recoveries, for Au, Mo and Re substantially, for Au less so as the leaching recoveries were given the benefit of the doubt.
Apart from recovery the quality of products is also economically important as it determines the amount of metal that will be paid for by offtakers. As is observed in the PEA “the pyrite to copper sulphide ratios ranges from 6 to 28 in the samples tested, with the highest ratios in Hushamu SCP material. These elevated pyrite ratios require selective pulp chemistry and fine regrinding to generate marketable copper concentrates”. One would therefore expect concentrates with relatively low copper and molybdenum contents.
Unfortunately, the discussion in the PEA report also falls short here as it does not give a clear conclusion what it forecasts. Similarly as for information for recoveries obtained, it includes in its Table 13-4 on flotation testwork results for the quality of cleaner concentrates. Figure 2.5.1_7 shows the Cu-content in concentrates as function of head grade for Hushamu composites.
The results above are surprising with very high Cu-contents for relatively low feed grades. However, these feed grades are totally unrepresentative. There is a clear relationship and Crux Investor concludes that a concentrate grade of 22% Cu can be expected at the mineable inventory grade. Without graphing it, the results for NWE and Red Dog seem similar.
The leap of faith with respect to achieving a Mo concentrate at a 90% recovery without supporting testwork comes with the additional shortcoming of not providing information about the concentrate quality. Crux Investor has referred to the technical report dated September 2024 for the Thompson Creek project of Centerra. This deposit has a Mo grade that is almost eight times higher than the Mineable Inventory grade of North Island. The technical report forecast a recovery of 90.5% (almost the same as the Northisle PEA suggests!) for a concentrate grading 53.6% Mo.
Processing
Based on the preliminary testwork a process flow is proposed that includes single stage crushing, semi autogenous grinding (“SAG”) milling, ball milling, bulk flotation, and separate rougher and cleaner tailings leaching. The first module of the plant will treat Red Dog and NWE mineralisation at a processing rate of 40 kt/d (i.e. 14.6 million tonnes per annum (“Mtpa”)). For treating mineralisation from Hushamu after the first five years another 40 kt/d module will be constructed, but also a pebble crusher circuit to assist SAG milling and a molybdenum flotation circuit will be constructed to process the bulk concentrate, separating copper and molybdenum. The leaching circuits will be reconfigured to treat cleaner tailings only.
Grinding of the feed will be to a particle size of P80 minus 150 micron. The bulk concentrate that needs regrinding for cleaning will have a mass pull of 13% for NWE and Red Dog, increasing to 19% for Hushamu. Regrinding will be to P80 minus 15 microns. This will add substantially to processing cost.
Economic Valuation
Metal Prices Used and Scenarios Analysed
Usually Crux Investor recreates the cash flow model of the technical report to verify all issues were properly covered and the tax calculation arrives at the same overall sum. However, in the case of the Northisle PEA too many inputs are missing for this to be possible. Table 16-6 of this report with the production schedule is full of informational gaps such as leaving out the Re grade (referred to as Ag grade) in the first half of the table. No concentrate qualities are provided, which is important to derive actual payability and off-mine costs. Fortunately Table 22-5 in the Economic Assessment section provides some of the missing information.
Crux Investor has used the spot metal price on 5 August 2025: US$4.38/lb Cu, US$3,372/oz Au, US$23.80/lb Mo and US$3,690/kg Re. For payability a rate of 96.5% was assumes subject to a minimum deduction on one percentage point of the concentrate grade, for Au in concentrate 96.5% was used subject to a minimum deduction on 1 g/t Au in concentrate, 99% payability for Mo and 80% for Re. For realistic treatment charges reference was made to a technical report dated September 2024 relating to the Thompson Creek molybdenum project. Treatment charges of US$323/t concentrate are used and refining charges of US$0.55/lb payable Mo for total treatment charges of US$37 million over the life of the project.
Production Schedule
Figure 2.6.2_1 shows at the top the mine production schedule with relatively high waste strip ratio in the early year before mining at Hushamu starts, but with much higher feed grade (expressed as NSR value) as shown in the plant production schedule.
Crux Investor has adopted these schedules, but used the recoveries derived in Table 2.5.1_1.
Table 2.6.2_1 shows the differences between metal production as per PEA and the Crux Investor model.
The table demonstrates that both copper and gold production are forecast to be approximately 11% lower, but Mo and Re production will be a fraction of what is forecast in the PEA.
Capital Expenditure
Table 2.6.3_1 shows the capital cost estimates for initial construction, expansion capital and sustaining capital. The PEA gives the numbers in Canadian Dollars, but Crux Investor has converted these to US Dollar using the PEA exchange rate of US$0.76 per Canadian Dollar. Once converted the provisions look a lot less impressive.
The capital provisions for the processing plant amount to US$281/monthly tonne capacity for the initial plant and US$224/monthly tonne for the expansion. These provisions are far too low, probably by a factor 2. This is in particular so as the plant will comprise not only a crushing/milling and flotation circuit, but also a cyanide leaching section to produce gold in doré. Crux Investor has doubled the provisions for processing plant.
The EPCM amounts convert to a rate of 11.5% and 13.9% of direct cost which is very low compared to conventional rates. These rates have however been used against the amended provisions.
The infrastructure provisions also look low for the size of operation, but without local insight Crux Investor has accepted the numbers.
The contingency amounts to only 18.7% of the sub total before the contingency. For a PEA level study this is too low and has been raised to 25% by Crux Investor, and also applied to sustaining capex.
Operating Expenditure
Table 2.6.4_1 presents the estimated operating cost as per PEA, again converted to US Dollar, but with costs comparison to other projects or mines. According to the PEA the costs were estimated based on first principles. The problem with first principles estimation is that it by definition is always too low. You can only estimate items and activities that are considered, failing to include those overlooked. In addition, such estimations assume perfect execution. For these reasons, first principles estimations should be checked against benchmarked numbers of similar operations.
However, it is very difficult to find Canadian companies disclosing their unit operating costs and, except for Mount Milligan, reference had to be made to technical reports on Thompson Creek (dated 1 September 2024) and Detour Lake (dated 20 September 2024) for such numbers. Being technical reports, they will tend to suffer from the same first principles estimation approach.
From the table above it is evident that only Thompson Creek has lower provisions for mining and processing, but it also has a much simpler process route focused on producing only a Mo concentrate. Primary grinding is to a much coarser P80 minus 212 microns and regrinding of bulk concentrate to P80 minus 45 microns. As the ore contains less than 1% pyrite, much less bulk concentrate will need regrinding than for the North Island project and pyrite separation is much less onerous.
From the above Crux Investor concludes that the suggested cost structure for North Island project is much too low. It has included in its model US$2.7/t for mining cost, US$8.0/t for processing and G&A of U$50 million per annum.
Royalties and Taxes
There is only a royalty of 3% on Red Dog production, of which Crux Investor assumes 2% point will be acquired for C$2.0 million. In addition “on portions of the Hushamu deposit” a 10% net profit interest (“NPI”) royalty applies. There is not much one can do with this “information”. How the NPI will be calculated is not defined and what production years are affected and to what degree is not disclosed. Crux Investor assumed that no depreciation/amortisation will be part of this calculation. The total LOM royalty in the PEA amounts to C$597 million, which is 4.6% of EBITDA. The Crux Investor model recreated the same percentage overall royalty.
As usual, the technical report gives virtually no information about how taxes were derived, one of the largest cash outflows in the cash flow model and important for the calculation of the net present value (“NPV”). The only two pieces of information are the overall effective tax rate over the life of mine of 38.2%, comprised of 24.9% for income tax and 13.3% for British Columbia mining tax and the amount involved: C$3.88 billion, or US$2.95 billion.
The latest published report on the method of calculating taxes for mining companies is by Price Waterhouse Cooper (“PWC”) dated 2016. Apparently since then auditing firms prefer parties to consult them directly. According to this document, at the time applicable taxes for mining companies in British Columbia were:
- British Mining Tax – two tier system based on “net revenue”;
- Federal Corporate Income Tax at 15.0%;
- British Columbia General Corporate Tax another 12.0%.
The British Columbian Mining Tax is levied in two stages: a 2% tax on “net current proceeds” and 13% tax on “net revenue”. The net current proceeds tax is a form of minimum tax, which is deducted in full, with an interest component, against the 13% net revenue tax.
The net current proceeds are defined as gross revenue (including forward sales, but ignoring hedging gains and losses) minus operating expenses and post-production development cost. With the exclusion of deductions for financing cost, capital expenditure and pre-production expenses, the effect is that taxes will be payable as from start of production.
The net proceeds tax is creditable against the 13% net revenue tax with a notional interest of 125% of the prevailing federal bank rate (at the time of the PWC report 3.75%).
The 13% net revenue tax base is derived by deduction from net proceeds sustaining capital expenditure, exploration costs and pre-production development costs.
With respect to Corporate Income Taxes, the tax base for Federal and British Columbian Provincial taxes should be calculated on the same basis: Earnings before Tax and Depreciation minus British Columbian Mining Taxes.
Interest is allowed as a deduction as well as amortization/depreciation which has the following components:
- Canadian Capital Allowance (“CCA”) – covering capital assets purchased, distinguished in assets purchased before start of commercial operation. These are allowed at 25% per annum on a declining balance basis. In recognition to the fact that assets are acquired throughout the year, only half the additions are eligible in the base to which the CCA is applied.
- Canadian Development Expense (“CDE”) - the acquisition cost of a Canadian mining property and associated mine development expenses, both initial and sustaining capital expenditure (exploration, studies, shaft, underground development) – 30% pa.
The PEA document does not give information of available balances for CCA and CDE. The annual financial statement for the year ending December 2024 includes the following statement: “Deferred tax assets have not been recognized as it is uncertain that the Company will have future taxable income against which they could be utilized”. Crux Investor could therefore not include such in its calculations.
Results
Table 2.6.6_1 summarises the LOM results and included certain amounts as per PEA model for comparison. It should be noted that the PEA presents its economic model chaotically and not in the logical format of Table 2.6.6_1 and the PEA numbers do not result in the net free cash flow figure.
The table illustrates that, despite much lower metal production, gross revenue is much higher than for the PEA thanks to higher spot prices, in particular the gold price. However, with adjustments to the operating costs the operating profit is only 10% higher. Somewhat surprisingly, the total tax amount is lower than arrived at by the PEA and constitutes an effective rate of 23.2% due to tax allowances for capital expenditure.
After adjustments to capital expenditure which are in total 47% higher than that in the PEA, Crux Investor arrives at US$4,103 million net free cash flow compared to US$4,335 million in the PEA. Surprisingly, the difference in NPV7 is much higher than the difference in net free cash flow, probably because Crux Investor does not discount negative cash flows during the pre-production period as these funds are raised upfront and do not earn 7% real return. The NPV7 amount of US$1,006 million amounts to 72% of initial capital expenditure. This drops to 57% when discounting at 8%, which Crux Investor considers more appropriate for modelling cash flow of a project.
This is only part of the story. With the considerable outlay involved for the expansion, the payback period is actually very long: 6.5 years as is evident in Figure 2.6.6_1.
Table 2.6.6_2 expresses the sensitivity of the value of the project as the change in NPV’s per percentage point change in the main parameters: metal prices, operating expenditure, and capital expenditure.
The sensitivity analysis demonstrates the marginal nature of the Northern Island project with the NPV8 increasing by 6.2% (US$48.7 million) for every percentage point increase in the metal prices and dropping by only 2.7% (US$21.4 million) for every percentage point increase in operating cost (i.e. US$0.15/t processed). Given the size of capital expenditure required, the NPV8 is relatively sensitive to changes in this parameter, changing 3.0% for every percentage point increase (i.e. US$37 million).
Developments Since The PEA
As is evident from Figure 1_1 whereas the findings of the PEA were well received, the share price increased sharply after 16 May 2025, well after their release. It is therefore appropriate to review the news releases thereafter to determine whether there have been further important developments.
On 28 April 2025 the company announced commencement of drilling at West Goodspeed and that NWE would also get attention “on identifying the intrusive associated with high-grade gold mineralization in this segment of the belt”. Figure 3_1 shows the location of the Goodspeed target areas in relation to the Red Dog deposit.
On 12 May 2025 Northisle started trading on the OTCQX market, which is just before the sharp increase in its share price.
On 2 July the results for the first four holes were released, reproduced in Table 3_1 with the weighted average grades compared to the overall declared resource grade for the North Island project.
The table shows that all holes have wide intervals with relatively good grades compared to the overall declared resource grade for the North Island project and the weighted average copper grades clearly exceed the copper resource grade. These results will have encouraged the market.
On 16 July 2025 the company announced its intention to raise C$25 million together with the advice that another C$5 million would be raised through a non-brokered private placement of shares with Wheaton Precious Metals Corporation (“Wheaton’). Only one day later another press release announced that the brokered placement had been increased from C$25 million to C$30 million ”as a result of strong investor demand”.
The above developments indicate that the market appreciates the recent exploration results and the plans of the company to add higher grade resources close to the higher-grade components, Red Dog and NWE, of the current resources. An endorsement from a major company such as Wheaton must also be seen as very positive.
The Enterprise Value of Northisle Copper and Gold on 5 August 2025
At the share price of C$1.34 on 5 August 2025, the market capitalisation for the 258.1 million shares is C$346 million, or US$251 million.
On 31 March 2025, the company had no warrants outstanding, but 9.8 million share options, which were all in the money at an average price of C$0.33. Another 2.6 million restricted share units and deferred share units were outstanding.
On 31 March 2025 the net current assets amounted to US$5.7 million. On 14 April there was a small private placement raising of C$0.175 million.
Based on the above an Enterprise Value on a diluted basis for Northisle of C$353 million (US$256 million) is derived as shown in Table 4_1.
The Enterprise Value is less than one third the NPV8 value calculated by Crux Investor.
Another metric to put the Enterprise Value in perspective is to express this as value per Au equivalent ounce in resources. Based on the relative contribution to overall revenue in the Crux Investor cash flow model, the other metals roughly double revenue. This implies that the declared resources contain 16.7 Moz AuEq metal, which converts the Enterprise Value to US$15/oz AuEq. Such a value is equal to 0.5% of the spot gold price. This makes the sudden interest in Northisle understandable.
To read the FULL report, for FREE, please subscribe below.
- Notification By Email When Our Latest Notes Are Published With Immediate Access As Soon As They Go "Live"
- Suggest Future Companies To Be Analysed (Launching Soon)
- Additional Related Notes and "How To's" To Aid You On Your Investment Journey.
Already a subscriber? Sign in