
Executive Summary
Newcore Gold Limited (“Newcore”) (TSX:NCAU) is a Canadian company that is advancing the Enchi gold project in Ghana, which is one of the best jurisdictions in western Africa. The diluted Enterprise Value on 17 July 2025 was US$98 million. With declared mineral resources of 1.72 million ounces (“Moz”) this equates to US$58/oz, which at 1.7% of the spot gold price looks low. It has caught the attention of Crux Investor and is the reason for this valuation report.
Newcore’s involvement in Enchi started in May 2014 when it entered into an agreement to earn a 100% interest in the project, the acquisition completed in December that year. Progress has not been as quick as the project already had declared mineral resources of 0.77 Moz in 2012, growing to 1.25 Moz in 2020 and which was the subject of a preliminary economic assessment (“PEA”) in 2021. The latest technical report, dated 7 June 2024, again reports on the findings of a PEA, this time with 1.72 Moz gold in mineral resources, 43% of which are classified as Indicated resources.
The updated mineral resource estimation (“MRE”) dated January 2023, on which the 2024 PEA was based, seems to have been well received, as the share price has been rising ever since.
The Enchi project is located in southwest Ghana on the border with the Ivory Coast. It is moderately well serviced by infrastructure, but the connection to the powergrid is at some distance. The 248 km2 tenement area covers 40 km of the Sefwi greenstone belt, a geological environment prospective for gold deposits controlled by thrust and fault structures. At Enchi the major structures are named from west to east, the Bibiani Shear (“BS”), the West Sewum Shear (“WSS”), and the Nyam Shear (“NS”). Numerous targets have been defined along these shears and their splays, but the most important are in the Sewum, Boin and Nyam areas and to a much lesser extent Kwakyekrom and Tokosea. Here, mineralisation is within zones of varying width that are sub-parallel to the fault structures.
For the MRE, three-dimensional wireframes for each mineralised zone were designed using criteria that included a minimum downhole width of 1 m and a minimum grade of 0.2 g/t gold. For Sewum, six zones were defined, containing 30 domains. Boin comprises 10 zones, almost all sub-parallel. The lodes within these zones vary from narrow (Zones 7-10) to wide (Zone 5). Nyam comprises six sub-parallel zones. The other deposit areas are not discussed in this report as these contain, at this stage, negligible resources.
Mineral resource statements are provided with a breakdown per area showing that Sewum, Boin and Nyam account for 91.6% of the gold contained, and with a breakdown for the oxidation stage. The problem Crux Investor has with this breakdown is that the technical reports fail to give proper definitions for the classification of mineralisation as Oxide, Transitional and Fresh. The illustrations also only provide an indication of the depth of the boundary between “the Oxide Zone” with Fresh.
Metallurgical test work has yet to prove that mineralisation in Fresh rock is amenable to heap leaching. However, the derivation of the cut-off grade for Fresh resources assumes such. This is a leap of faith that cannot be endorsed by Crux Investor and considers the numbers for Fresh mineralisation as invalid. Dropping out fresh rock mineral resources reduces the amount of gold contained to 1.0 Moz.
With almost 57% of the gold contained in Inferred Resources, it did not make sense to commission a feasibility study (“FS”) to declare mineral reserves, so a PEA was completed. This allows Inferred resources to be included in the business plan. The total material in such a plan can be referred to as Mineable Inventory.
The technical report provides the pit optimisation results for each of the deposit areas and, separately, a breakdown of these as Mineable Inventory of Oxide, Transitional, and Fresh material. A comparison between Mineral Resources and Mineable Inventory indicates that for Oxide and Transitional, respectively, 94% and 92% of contained gold are assumed converted at grades that are 12% and 10% higher. Given the often narrow nature of the lodes, this is unlikely in practice, as some degree of mining and internal dilution will apply.
The plan is to mine the deposits by conventional open pit operation, utilising an outside contractor employing small-scale equipment to drill and blast material, load, and haul mineralised material to a heap leach facility and the waste to nearby dump locations. All the Oxide and a considerable proportion of the Transitional resources are considered free-dig material. A heap leach facility halfway between the two largest deposits, Sewum and Boin, will process the Mineable Inventory.
Metallurgical test work indicates that the plant feed will have a large component of very fine material, requiring agglomeration with Portland cement at an application rate of 10 kg/t to give permeability and stability to the heaps and prevent slumping. Very rapid and high gold leach extractions are indicated for Oxide and Transitional material. After discounting for field-scale up, the average gold extraction rate was discounted to an average recovery of 88.6% for Oxide/Transition material. Crux Investor records a risk associated with the suggested recovery for Oxide/Transitional as the samples were predominantly drawn from trenches (= highest oxidation level) and of very fine material (= best liberation of gold grains).
This report has analysed two scenarios: the PEA Case, adopting all the inputs from Newcore to verify the accuracy of the Crux Investor model, and the Crux Investor model with inputs considered more realistic and incorporating charges ignored in the PEA. The most important differences are the removal of Fresh material from the production schedule and using the spot gold price at US$3,340/oz, instead of US$1,850/oz in the PEA Case.
The capital expenditure provisions in the PEA were given the benefit of the doubt and adopted despite being deemed optimistic. Operating costs were definitely too low, which Crux Investor based on a benchmarking exercise it completed for its Analyst’s Notes on Orezone in January 2023 and April 2024.
The results of the cash flow model for the PEA Case show almost the same net free cash flow, confirming a NPV8 of US$371 million. Despite dropping out the Fresh mineralisation from the production schedule, applying much higher unit operating cost, accounting for the 10% free-carried interest of the government, an 8% withholding taxes on repatriation of profits and corporate overheads in Canada, the Crux Investor Case arrives at a much higher NPV8 of US$482 million. The much higher gold price is very forgiving.
The cash flow model indicates that for every additional year life of mine (“LOM”) the NPV8 value would increase by US$85 million. For this reason, Crux Investor has carefully reviewed all drill results since the release of the PEA. Newcore provides a full set of results for all drill holes completed, including clear illustrations where these holes were drilled and many cross sections to provide context for the results. It exemplifies how exploration results should be released to the market. It allowed Crux Investor to gain good insight into the scope of work and what was achieved. From the review, it is clear that the aim is to convert resources to a higher confidence level category and that very little additional Oxide/Transitional resources can be expected from this drilling campaign.
This means that the valuation of US$482 million remains applicable. As a rule of thumb, at the PEA stage, a company trades at 0.2-0.3 x the NPV. Applied to Newcore, this would translate to US$96 million—US$145 million. With further de-risking, these numbers should increase.
In conclusion, Newcore Gold is not a bad investment opportunity.
Introduction
Newcore Gold Limited (“Newcore”) (TSX:NCAU) is a Canadian company that was incorporated in 2010 under the name Pinecrest Resources Limited, but changed its name to the current one in August 2020. Newcore engages principally in the advancement and development of the Enchi gold project in southwest Ghana.
The Enchi project has had a long history of exploration by various operators, including Leo Shield Exploration Ghana NL (“Leo Shield”) from 1995 to 1998, Redback Mining Inc. (“Red Back” now part of Kinross) from 2003 to 2010, Edgewater Exploration Ltd. (“Edgewater”) from 2011 to 2013, and Newcore Gold Ltd. (Newcore) from 2014 to present. Newcore’s involvement started in May 2014 when it entered into an agreement to earn a 100% interest in the project, the acquisition completed in December that year.
Progress has not been fast as the project area already had declared mineral resources of 0.77 Moz in 2012, growing to 1.25 Moz in 2020 which was the subject of a PEA in 2021. The latest technical report, dated 7 June 2024, again reports on the findings of a PEA, this time with 1.72 Moz gold in mineral resources, 43% of which classified as Indicated resources.
Currently the company is completing a 35,000 m drilling campaign, which is “focused on resource growth and infill drilling designed to convert inferred mineral resources to indicated mineral resources”. The objective is to commission a pre-feasibility study (“PFS”) in H2 2025.
At a share price of C$0.57 on 17 July 2025 Newcore’s market capitalisation was C$145 million. At 31 March 2025 the company had a cash balance of C$14.8 million, sufficient to cover the cash burn rate of the Q1 2024 quarter for three more quarters. The diluted Enterprise Value on 17 July 2025 was C$144 million (US$98 million) with all warrants and almost all share options in the money. The share price performance since early 2024 explains why these are now in the money, refer to Figure 1_1.
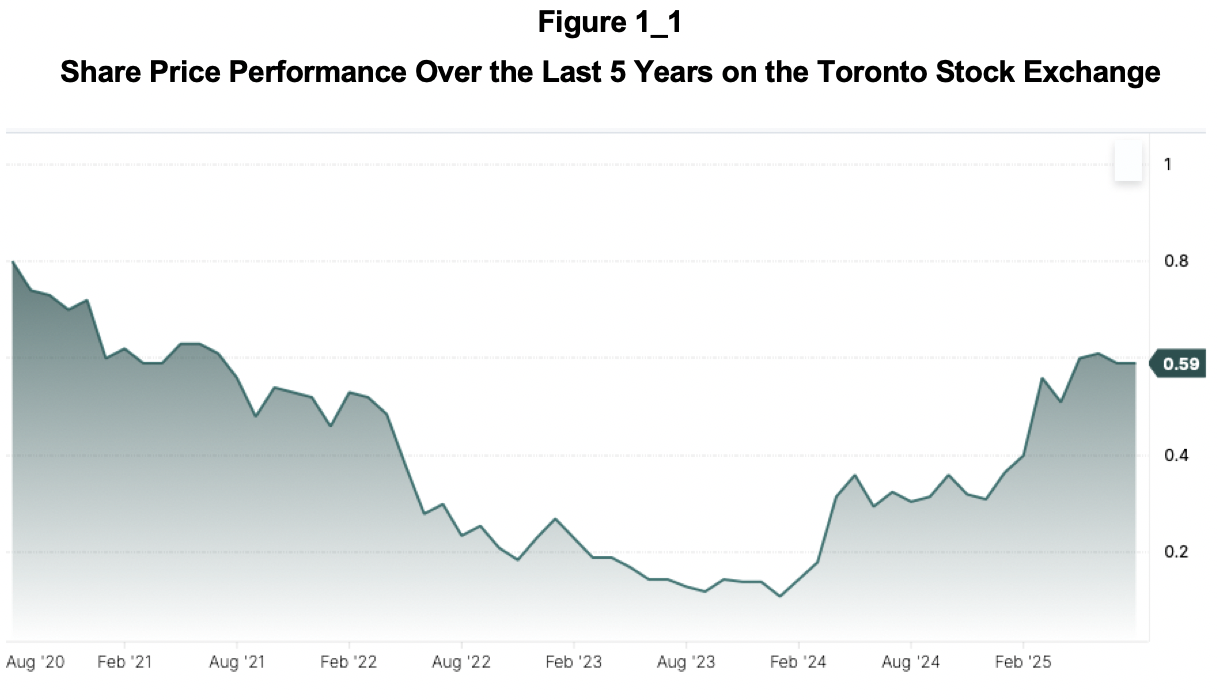
The Enterprise Value values mineral resources at US$57/oz. This does not seem onerous, which is why Crux Investor decided to investigate the company and its project further.
Valuation of the Enchi Project
Background
The information in Sections 2.1 to 2.6.5 of this report is derived from a NI.43-101 compliant technical report dated June 2024, authored by Lycopodium, reporting on the findings of a PEA.
The project area is located 290 km west of the capital of Accra and the town of Enchi is located 10 km to the west (see Figure 2.1_1).

The project can be accessed from Accra on sealed roads via the regional port city of Sekondi (Takoradi) or the mining centre of Kumasi. From either of these centres, a paved road leads to the town of Enchi. Access through the remainder of the project area is by dirt and gravel roads.
Enchi is located 77 km north of the substation at Elubo, serviced by a 225 kV line, and 122 km southwest of the substation at Asawinso, serviced by a 161 kV line.
The Enchi tenement area includes six prospecting licenses and three applications for prospecting licenses, comprising a total of 248 km2 land package. Figure 2.1_2 shows the shape and extent of the tenement area.
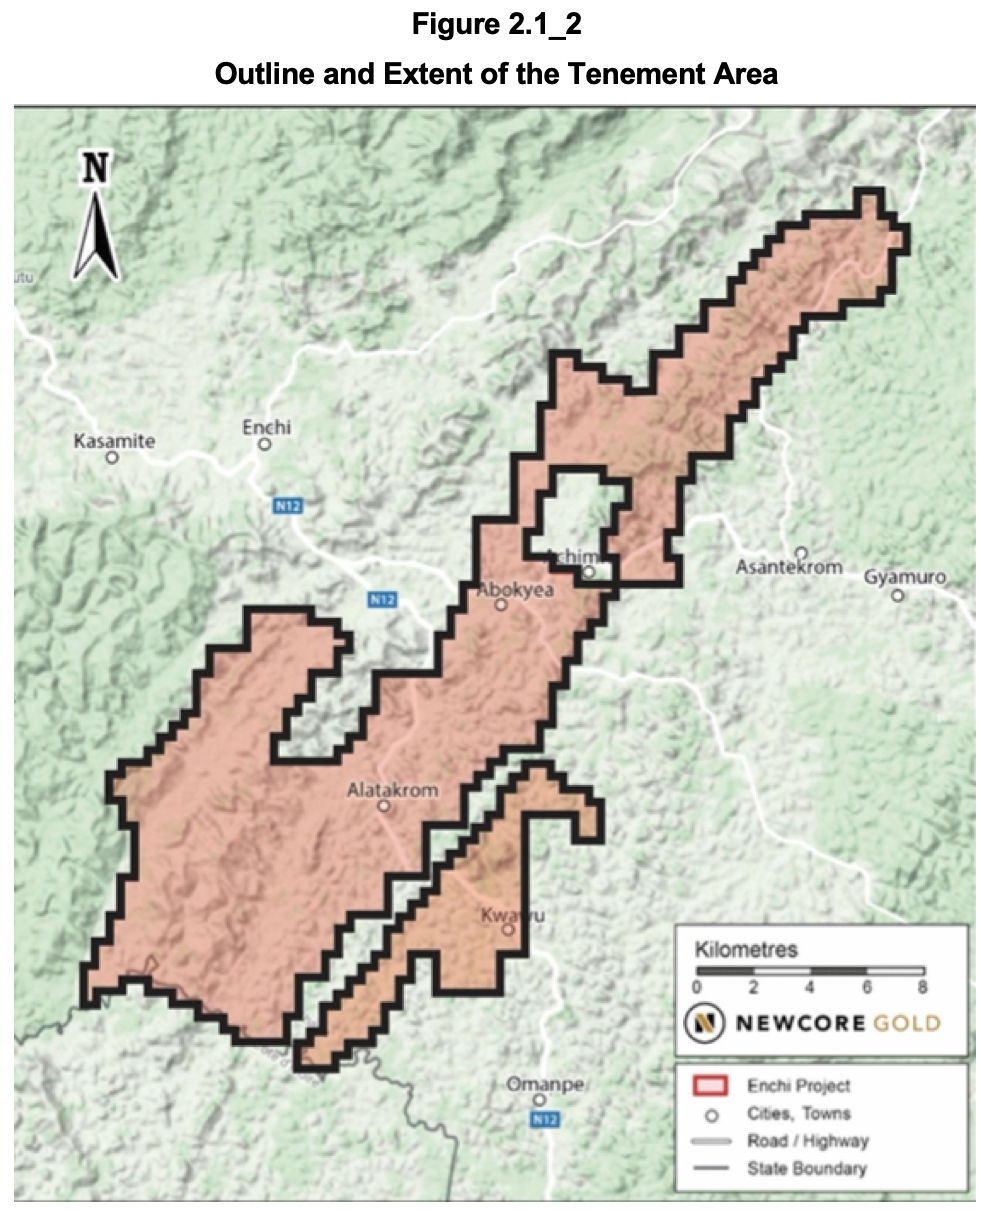
The tenements cover a 40 km strike length of the eastern margin of the Sefwi Belt stretching from the Ivory Coast border in the southwest to neighbouring claims to the northeast.
Triple Flag Precious Metals Corp. holds a 2% net smelter returns royalty (“NSR”) on the project's production (with 1% subject to a buy-back option for a lump sum payment of US$3.5 million at any time held by Sandstorm Gold Ltd.). The government levies a 5% royalty on revenues.
Geology and Mineralisation
The Sefwi Belt is dominated by mafic volcanics, metasediments, and intrusive granitoids that are sandwiched between sedimentary basins. The belt is traceable for 260 km along strike and is usually 30 km to 60 km wide. The metavolcanic and metasedimentary sequences are believed to be contemporaneous, with the sediment deposited in basins eroded from the adjacent volcanic terrains.
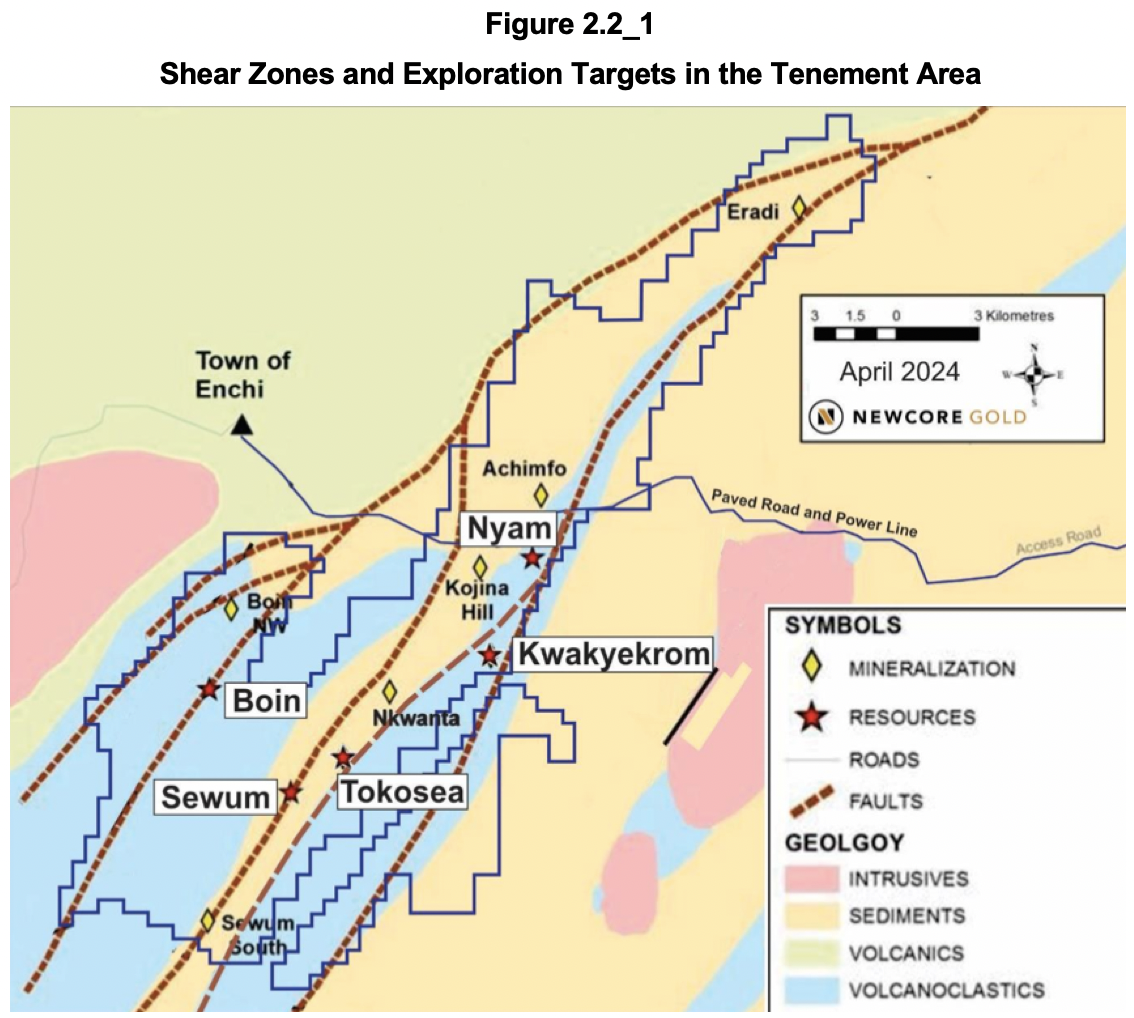
Extensive faulting occurs along the margins of the volcanic-sediment belts. Observed at local and regional scales, these northeast-trending structures are fundamentally important in the development of gold deposits for the region. The primary shear system within the Enchi concession at the Sefwi Belt and Kumasi Basin's boundary is the Bibiani Shear Zone. Gold deposits are located in third-order structures that splay-off the second-order structures and are sub-parallel to the overall trend of the Bibiani Shear Zone. The Bibiani Shear Zone has been traced for 40 km on the Project area. Major structures within the Project are named from west to east, the Bibiani Shear (“BS”), the West Sewum Shear (“WSS”), and the Nyam Shear (“NS”). Figure 2.2_1 shows the various shear zones in relation to the tenement area and the most advanced targest indicated by red stars. Of these Sewum is the most important in terms of mineral resources, followed by Boin and then Nyam.
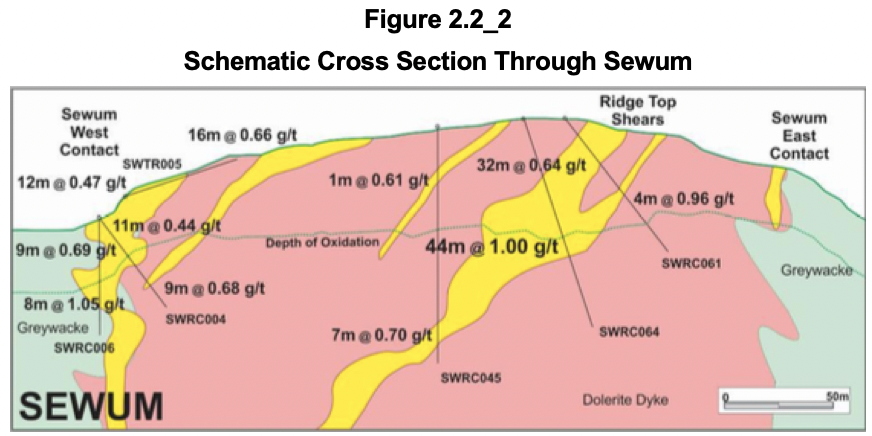
The Sewum prospect is found along the eastern contact of a thrust-bounded volcanic sliver, outcropping 6 km to the east of the Boin Zone on the BS. Sewum is situated along several major thrust zones that crop out across the regional 3 km wide north-south corridor. Figure 2.2_2 shows a schematic cross section showing the zones with mineralisation in a yellow colour.
The Sewum Shear Zone represents a major regional structure that can be traced 25 km south from where it branches off the Bibiani Shear Zone. The shear has a complex anastomosing geometry with numerous splays and has played a major role in localising gold mineralisation in the Sewum area. Striking north-northeast, the Sewum Shear is typically vertical to steep west-dipping and can be up to 100 m wide.
The presence of the dolerite body within the Sewum Shear Zone is significant in that the intrusive represents a more competent rock type compared to the surrounding sediment and is more likely to deform in a brittle manner during faulting and deformation, potentially making a more permeable host to mineralisation. Mineralised breccia and stockworking are commonly found along the margin of the dolerite dyke: the east contact zone (“ECZ”) and the west contact zone (“WCZ”).
The section above shows that one of the most significant zones of continuous gold mineralisation identified in drilling at Sewum is the Ridge Top Shears Zone (“RTSZ”), related to a series of close-spaced, moderately dipping shears up to 20 m thick hosted within a dolerite dyke.
At the Boin prospect the BS is one of several major structures that splay off the Bibiani Shear. It is interpreted as a thrust fault, dipping moderately west and is responsible for the development of the zone of mineralised quartz veins. It has been tested over 11 km at shallow depths over regular intervals. A generalised section is shown in Figure 2.2_3.
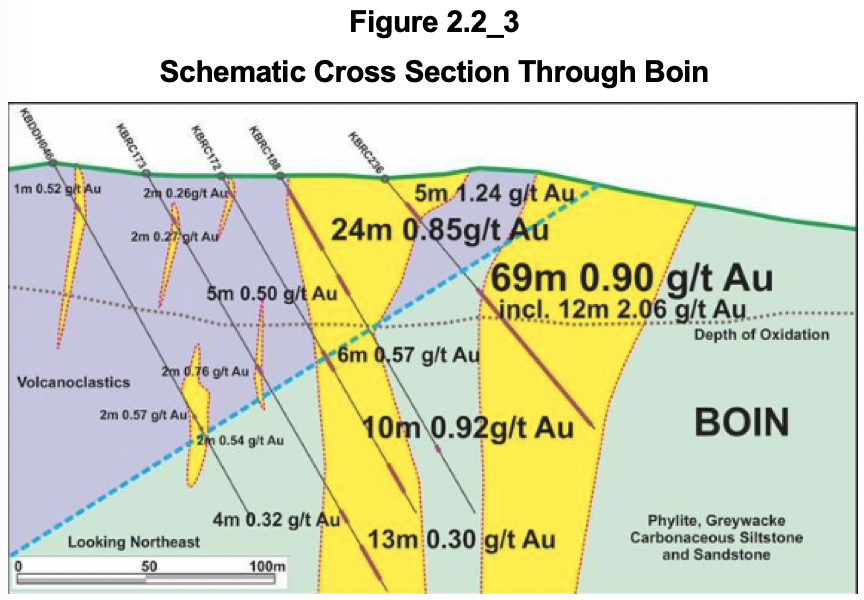
The whole contact is expressed as a 10 m to 30 m wide graphitic shear zone, which trends NNE to NE and dips west at 30 degrees to 70 degrees.
The Nyam Zone strikes over a distance of 2.1 km, and is 200 m to 300 m west of the interpreted position of the second-order NS structure. The zone of mineralisation lies in the hanging wall of a northeast-striking shear that dips 70 to the east and is up to 30 m thick. An extensive envelope of weak gold mineralisation (more than 0.25 g/t) dips sub-vertically and strikes NE.
Figure 2.2_4 contains a schematic cross-section through Nyam.
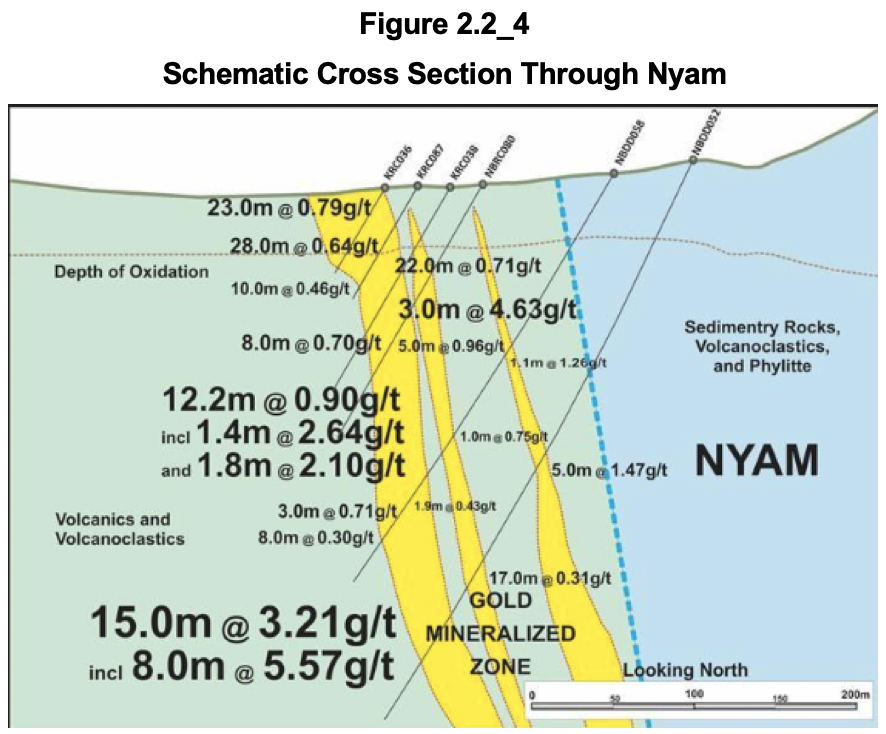
Mineralisation at the Nyam Zone is composed of veined and brecciated sediment and lesser intrusive rocks cemented by quartz, ankerite (Ca(Fe,Mg,Mn)(CO3)2), and albite. It has been traced continuously by trenching and drilling for over 2 km strike length.
On the three cross sections above, the depth of oxidation is shown, above which the sulphides have been turned to oxide minerals, and liberated the gold from the sulphides. This is a critical economic aspect of the deposits, as will be discussed in later in Metallurgy and Processing Operations - Metallurgical Test Work.
Mineral Resources and Mineral Reserves
Mineral Resources
The mineral resources in the PEA simply adopted the estimation carried out by BBA E&C incorporated (“BBA”), which became effective on 26 January 2023 after a review by SEMS Exploration Services Ltd (“SEMS”). A review of the BBA technical report indicates that the cut-off dates for inclusion in the MRE are generally the end of 2022 and even the end of 2021 for Nyam. Given the scope of work since then, the MRE can be considered outdated.
Mineralised wireframe outlines for each of the deposits were created by sectional digitising of mineralisation on 25 m to 200 m intervals. Drillhole spacing is variable but with most of the surface drilling collared on 25 m to 75 m sections. Three-dimensional wireframes for each mineralised zone were designed using criteria that included a minimum downhole width of 1 m and a minimum grade of 0.2 g/t gold. However, due to the variable geometry of mineralisation and to provide continuity there are portions within some wireframes that have grades less than 0.2 g/t Au. The model extends the wireframes where the mineralisation was not considered closed off. Despite classifying these to contain Inferred resources only, Crux Investor deems this a risky approach.
For Sewum, six zones were defined, containing 30 domains. Boin comprises 10 zones, almost all sub-parallel. The lodes within these zones vary from narrow (Zones 7-10) to wide (Zone 5). Nyam comprises 6 sub-parallel zones. The other deposit areas can be ignored as having negligible resources for the purposes on the MRE.
According to SEMS a composite length of 1 m was chosen (BBA states however a 2 m kength), which is short and indicative of the many narrow lodes. Grade capping was applied to composite grade assays. The table for the capped composite statistics does not provide the coefficient of variation (“CV”), but it does give means and variance from which the reader can derive CV’s. These are generally low, which is good.
Variography was carried out for Sewum, Boin and Nyam and the results presented in table form. No semi variograms are presented, leaving the reader to simply accept the results. This is, in the opinion of Crux Investor, unacceptable. It is up to the Competent Person to demonstrate the reasonableness of the assumption used.
A block size of 10 m x 10 m x 10 m was selected to accommodate the nature of the mineralisation and to be amenable for potential open pit mining. Sub-cells of 2.5 m x 2.5 m x 2.5 m were used to estimate the wireframes' volume. For Boin the sub cells were 1.25 m x 1.25 m x 1.25 m. Block grades were estimated using nearest neighbour, inverse distance to the power 2 (“ID2”), and ordinary kriging. Hard borders were used to prevent composites in a particular wireframe informing on block grades in another wireframe.
Low unit cost rates were used for the reasonable prospect of eventual economic extraction (“RPEEE”), but this is more than compensated for by a very low gold price of US$1,650/oz. More seriously, metallurgical recoveries for treating fresh rock were used, which are totally unsupported by metallurgical test work (refer to Metallurgy and Processing Operations - Metallurgical Test Work later in this report ).
Whereas the PEA report suggests an effective date of 24 April 2024, the mineral resources have an actual effective date of 26 January 2023. Table 2.3.1_1 and Table 3.2.1_2 show the declared mineral resources, which were effectively estimated by BBA, the top-most table with resources for each target area, and the second table resource per oxidation state.
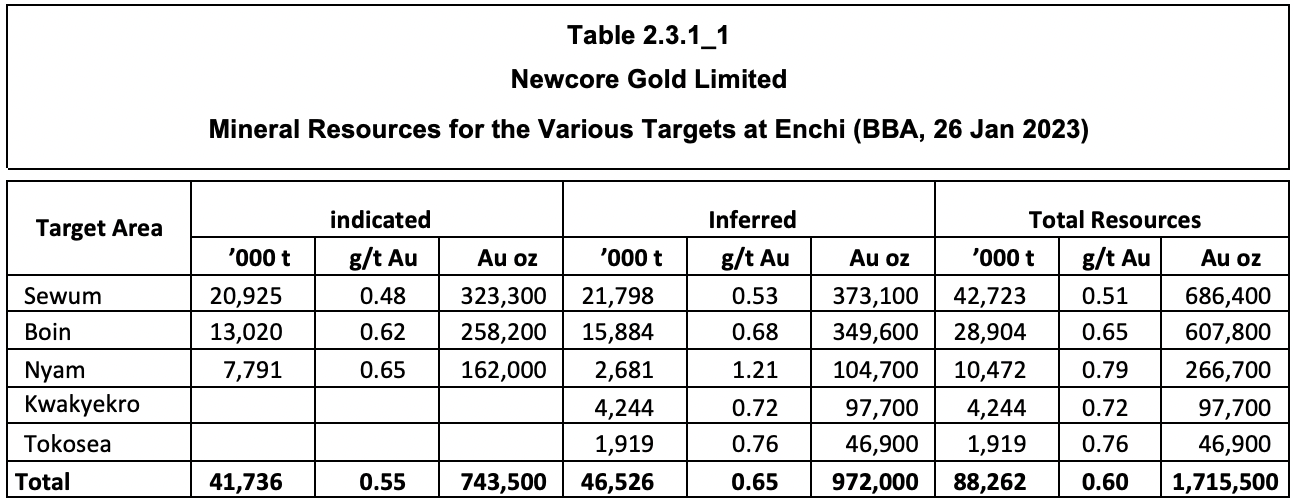
The table shows that Sewum, Boin and Nyam account for almost 92% of the gold contained in total resources.
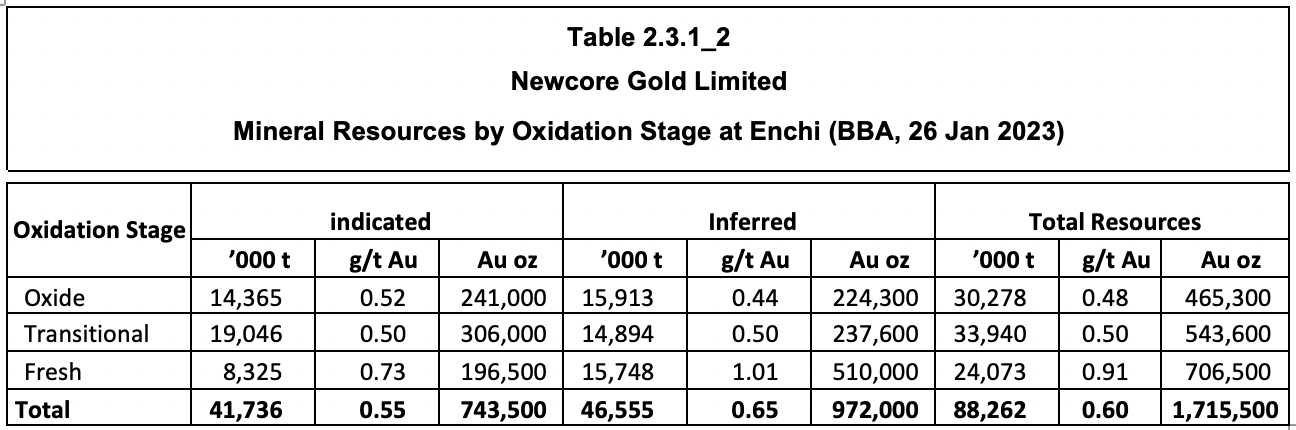
The table indicates that almost 59% of the contained gold is present in Oxide and Transitional material, with Oxide alone acconting for more than 27%. This is surprisingly much considering the shallow level at which the maximum depth of the Oxide zone is indicated in the three cross sections above, varying between 50 m and 75 m.
It does not help that nowhere in the geological discussion clear definitions were given for classifying Oxide, Transitional and Fresh. In particular a proper definition of Transitional is missing.
Moreover, Table 14.3.2 of the 2024 technical report gives the number of samples used to establish the specific gravity for material by oxidation stage with 98 used for Oxide, 794 for Transitional, and 2,751 for Fresh. Either measurements were taken very much biased towards Fresh material, or the definition for oxidation stage was used very inconsistently.
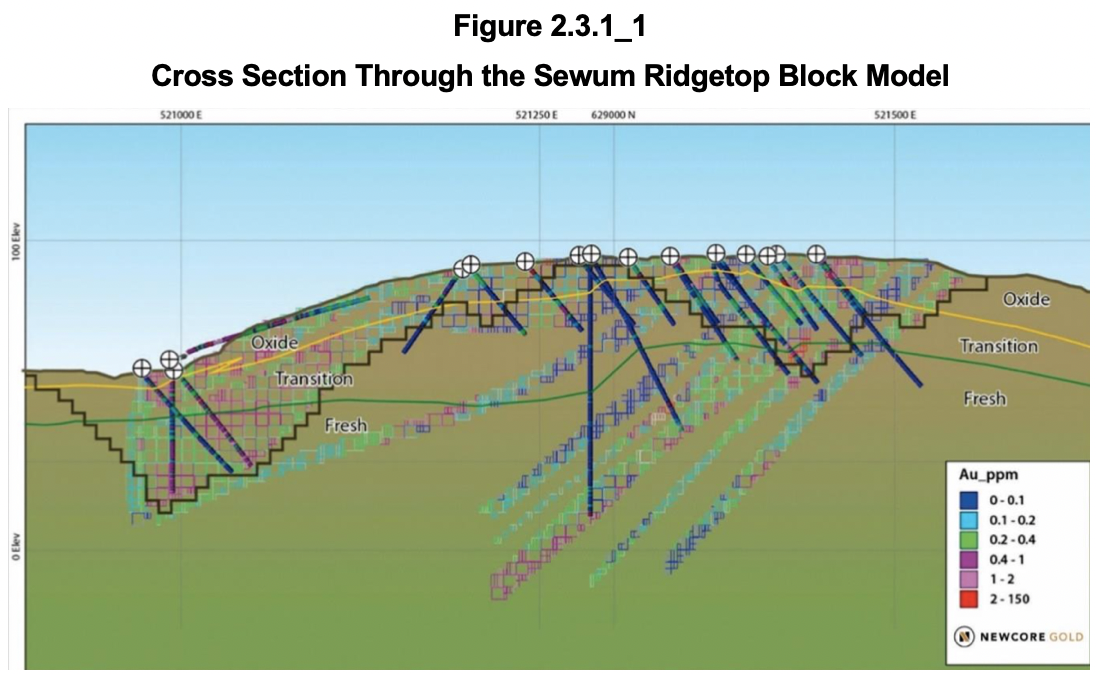
The technical report gives excellent visual verification providing numerous cross sections comparing block grades with borehole intersection grades. Below is such a cross section for the Sewum Ridgetop area, also illustrating that the top of fresh rock is approximately at 50 m depth with Oxide accounting for slightly more than half that depth. For scale, use the coordinates along the top.
The cross section below is for Boin Central showing the top of fresh rock again at a depth of approximately 50 m and again with Oxide reaching to half that depth.
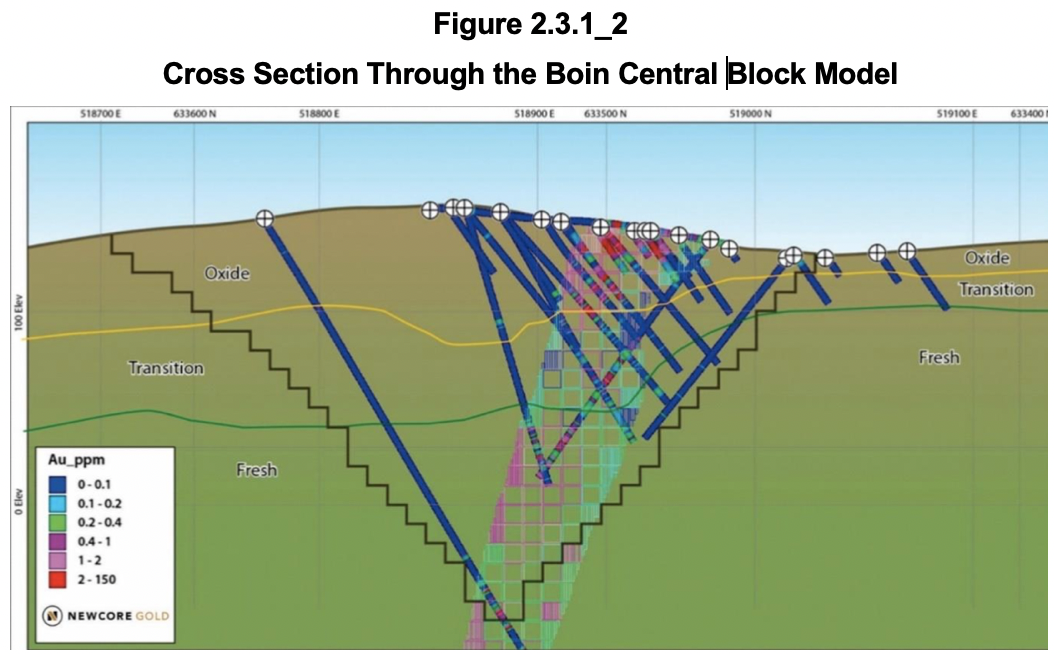
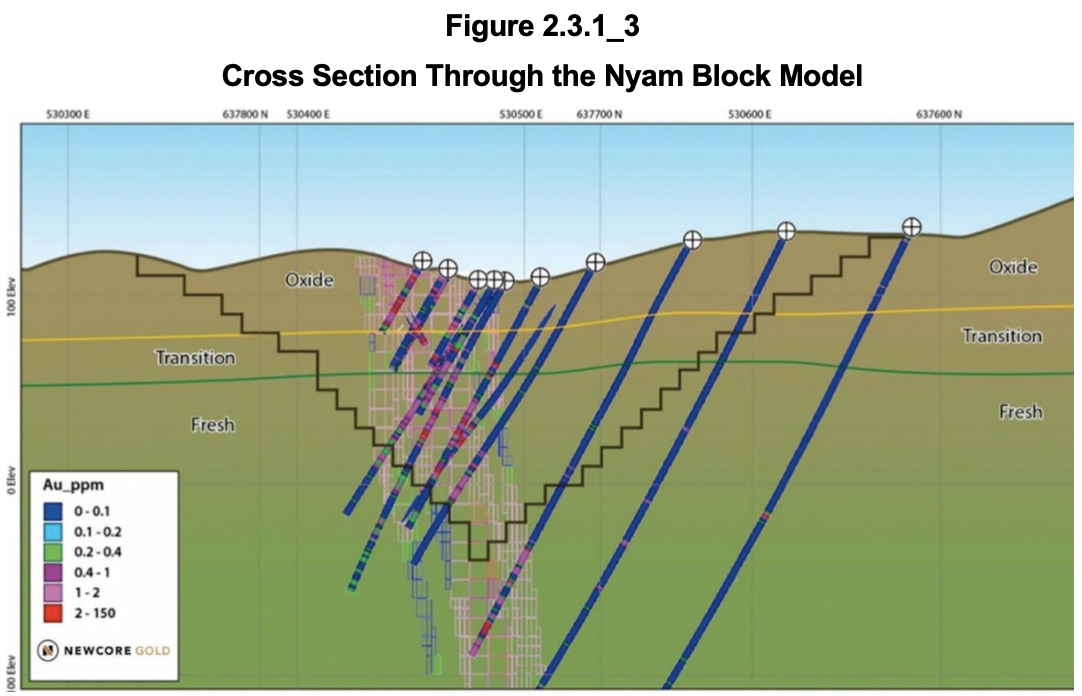
Figure 2.3.1_3 contains the cross section through the Nyam block model with fresh rock again at approximately 50 m depth and the depth of Oxide material a bit more than half this distance.
Crux Investor rates the discussion about oxidation stage and their (lack of) definition in the technical report as being very unsatisfactory, in particular, in the light of the economic significance of the oxidation stage (see Section 2.5.1).
Mineable Inventory
With almost 57% of the contained gold in Inferred Resources it did not make sense to declare Mineral Reserves by carrying out a Feasibility Study (FS) and a Preliminary Econommic Assessment (PEA) was therefore completed. This allows Inferred resources to be included in the business plan. The total material in such a plan can be referred to as Mineable Inventory.
Pit optimisation has used a very low gold price of US$1,650/oz and taken account of the applicable royalties, used reasonably conservative pit slope angles, low unit costs for mining, processing and general and administration (“G&A”) expenses, has ignored dilution and assumed very low mining losses of 4%. The assumed metallurgical recovery was 85% for Oxide and Transitional material, 75% for Fresh.
The technical report provides the results of the pit optimisation for each of the deposit areas and, separately, a breakdown of these Mineable Inventories as Oxide, Transitional and Fresh material.
Table 3.2_1 combines both breakdowns to verify the internal consistency of the numbers provided.
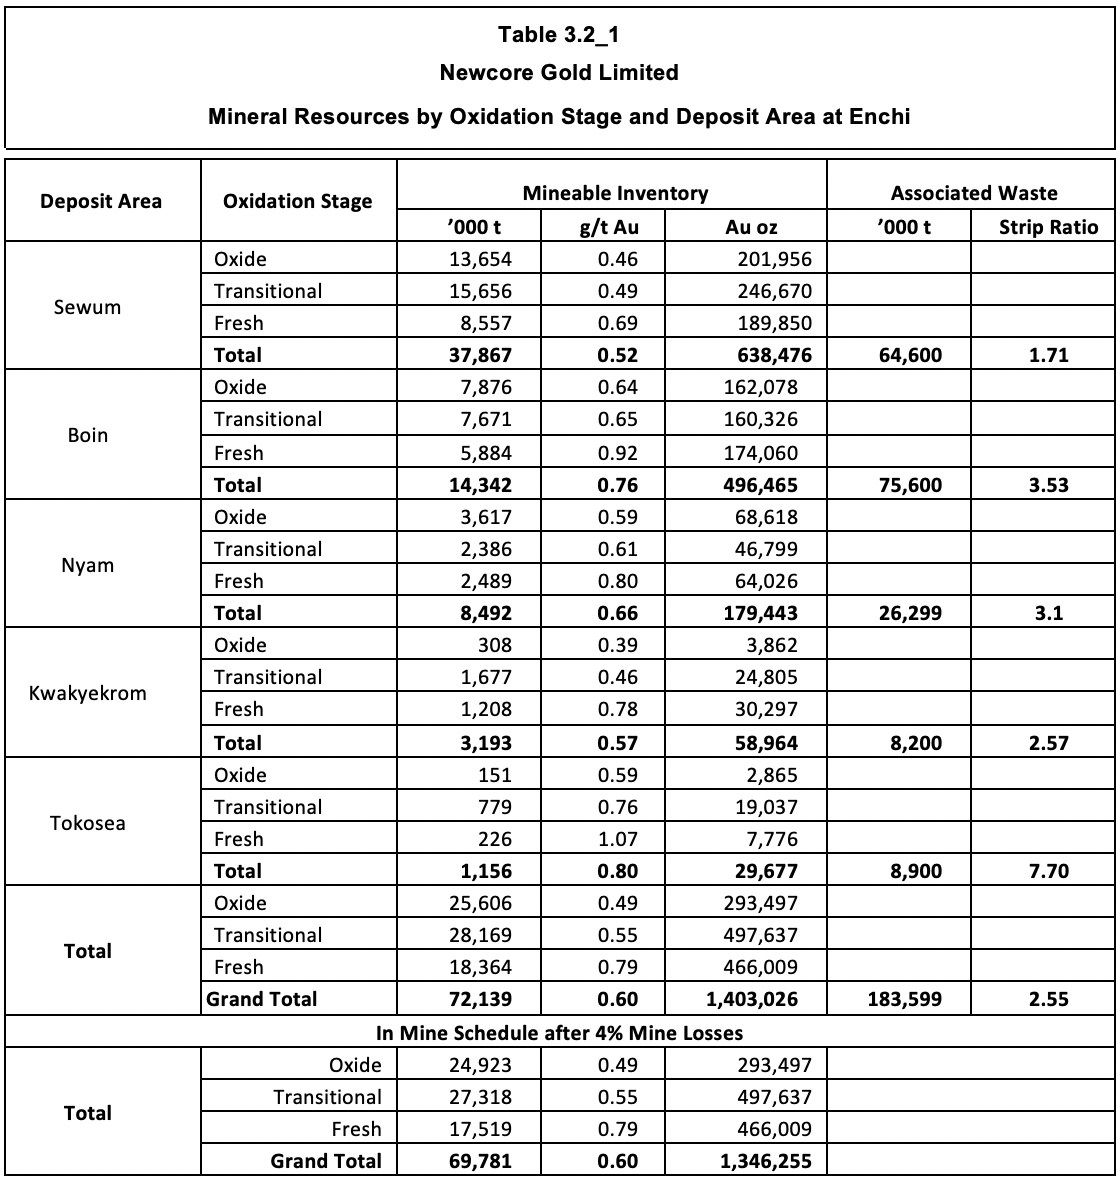
Comparison between Mineral Resources and Mineable Inventory indicates that for Oxide and Transitional respectively 94% and 92% of contained gold are assumed converted at grades that are 12% and 10% higher. Given the often narrow nature of the lodes, this is unlikely in practice as mining and internal dilution will apply.
With reference to Section 2.5.1, which will demonstrate that there is no basis to assume Fresh material to be economically amenable to heap leaching, no such mineral resources should have been declared, and no mineable inventory is applicable. The implication is that gold contained in the life of mine (“LOM”) plant feed should be dropped by one-third.
Mining Operations
The plan is to mine the deposits by conventional open pit operation, utilising small scale equipment to drill and blast material, load, and haul mineralised material to a heap leach facility and the waste to nearby dump locations. Mining will be conducted across nine open pits in 10 m bench increments. Contract mining has been assumed.
Figure 2.4_1 shows the various pits and the location of the planned heap leach facility between the two largest resource areas: Sewum and Boin.
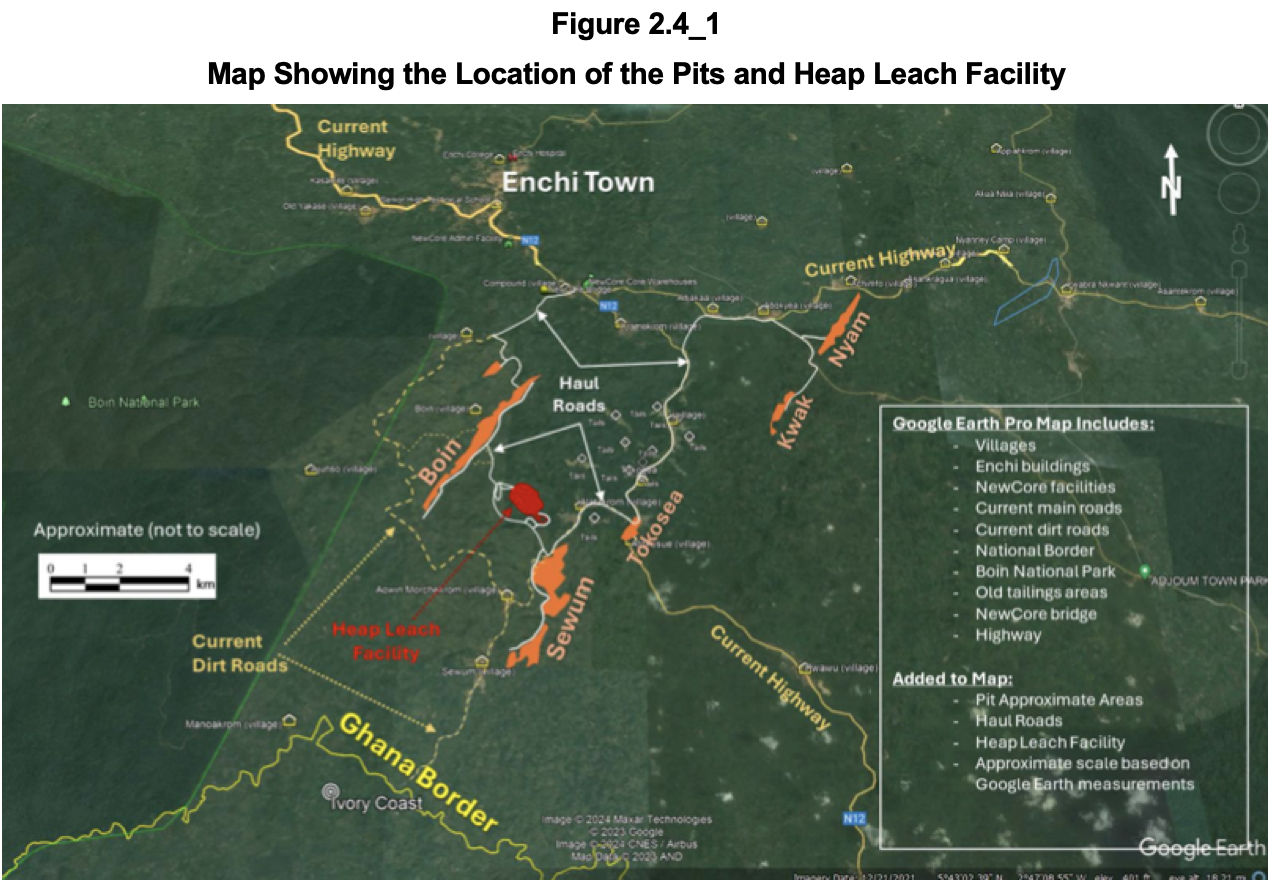
Oxide material will be free dug by hydraulic excavators without requiring any drilling or blasting. It is “assumed” (= not very confidence inspiring) that the upper 50% of transition material is sufficiently broken and may be free dug as well. The bottom 50% of transition material is considered competent and will be drilled and blasted along with all fresh material.
Metallurgy and Processing Operations
Metallurgical Test Work
The discussion about metallurgical test work differs considerably in the 2023 MRE technical report and 2024 PEA report, with the former giving more detail.
Much of the test work is irrelevant to supporting heap leaching with much bottle roll testing and with column leaching of material that is much finer than envisaged for the production process. For example, the 2nd Phase Column Leach Test carried out in October 2022 on two composites of Sewum and one from Boin had almost three-quarters finer than 2 mm and calculated head grades much higher than the resource grades, averaging 0.75 g/t Au. After agglomeration, the samples were found to leach fast and with a high extraction rate, averaging 92.4%. Reagent consumption was low. The 2023 MRE report concludes that “column leach tests confirm that gold extraction via cyanidation is generally good for the oxide and transition domains of the Boin, Sewum and Kwakyekrom deposits”. Note that this excludes fresh material and the Oxide and Transitional material for Nyam.
The 2024 PEA report also includes testwork results subsequent to the MRE report. Tests in 2022 – 2023 at the University of Mines and Technology (UMaT) in Tarkwa, Ghana confirmed previous heap leach results.
In 2023 Oxide material from trenches at Boin and Sewum, again with very fine material requiring agglomeration and with much higher grades than the mineral resources were tested for gravity separation and subjected to column leaching. Gravity concentration proved relatively ineffective. Column leach recoveries averaging 91.7% were excellent, but slumping averaged 15.4%, which is above industry standards.
In August 2023, composites of fresh rock at Nyam were tested, but not for heap leaching. In the same month, Oxide material from trenches at Tokosea was tested by bottle roll leaching. From this Crux Investor concludes that there seems to be no systemic approach to the metallurgical test work to reach firm conclusions about heap leaching the resources.
Also in 2023, trench samples at Boin and Sewum were selected for bulk-scale pilot heap testing over 60 days. The samples consisted of blended Oxide material with individual samples and composites “covering a range of gold grades”. The report omits to provide average grades for these samples. The agglomerated composites were leached, yielding overall recoveries in excess of 90%. After discounting for field-scale up, the average gold extraction rate was discounted to an average recovery of 88.6% for Oxide/Transition material. There is risk associated with the suggested recovery for Oxide/Transitional, as the samples were predominantly drawn from trenches and of very fine material. No grades were provided compared to the resource grade. The application of discounts to the results mitigates to some extent the risk.
For the purposes of this report, only test work that is focused on heap leaching is of relevance. The report specifically mentions that no column tests were completed for any sulphide samples. Yet, the report suggests an average recovery of 75% for Sulphide mineralisation. Crux Investor rejects this leap of faith and rejects this number as totally unsubstantiated. No mineral resources should have been estimated for Fresh mineralisation until this is resolved.
Processing
Run-of-mine (“ROM”) material is assumed commuted, first in a primary mineral size to P80 minus -40 mm, followed by two-stage crushing to P80 minus 19 mm for transitional and fresh material. This is followed by agglomeration with cement and cyanide solution in a rotating drum, from which grasshopper conveyors and radial stackers will transport the material on the leach pad in 5 m lifts.
Cyanide solution will be applied to the heap at a rate of 10 l/m2/hr for a 40-day ‘transition’ period. This rate will then decrease to 7 l/m2/hr for a 40 -day period. Leaching of each cell will continue after the 70 days due to solution trickling down from the cell(s) above, and the cell will not be drained until reaching 90 days. The pregnant solution will be collected and exposed to activated carbon to capture the gold. The Zadra process will elute the gold from the carbon and the sludge treated by electrowinning and melted to a doré product.
Economic Valuation
Metal Prices Used and Scenarios Analysed
This study has considered two scenarios:
- Adopting the input parameters of the PEA to verify nothing has been overlooked and to what extent the income tax calculations are similar (“the PEA Case”). The gold price in the PEA is US$1,850/oz.
- Using inputs that Crux Investor considers more realistic, including charges ignored in the PEA, including sunk exploration and evaluation expenses for tax deduction and using the spot gold price on 17 July 2025: US$3,340/oz: the Crux Investor Case.
Net revenue is derived from gross revenue minus treatment and refining charges of US$4.0/oz sold and after deducting the government royalty of 5% and the royalty to Triple Flag. The PEA assumes 2%, but Crux Investor has assumed that Newcore will buy back 1% point for US$3.5 million before the start of production.
Production Schedule
The PEA provides an annual production schedule in its Table 16.5.2 with tonnages for Oxide, Transitional, Fresh and waste material together with total gold contained in the various mineralisation types. There is no mining during the one-year pre-production period, and processing is supposed to reach the steady state rate of 8.1 million tonnes per annum (“Mtpa”) in Year 1. During the period from Year 1 to Year 4, only Oxide and Transitional material is mined and treated. Year 5 is a year of transition with Fresh material supplementing Oxide and Transitional, after which only Fresh material is mined and treated.
The PEA Case fully adopted the provided schedule, but the Crux Investor Case ignored any contribution of Fresh material because it still needs to be proven to be amenable to economical heap leaching. The Crux Investor Case production profile, therefore, sees a drop off in annual treatment rate after Year 4 compared to the PEA Case (see Figure 2.6.2_1). In practice, the treatment rate would be maintained for a much shorter LOM. The diagram also shows the feed grade profile for both scenarios.
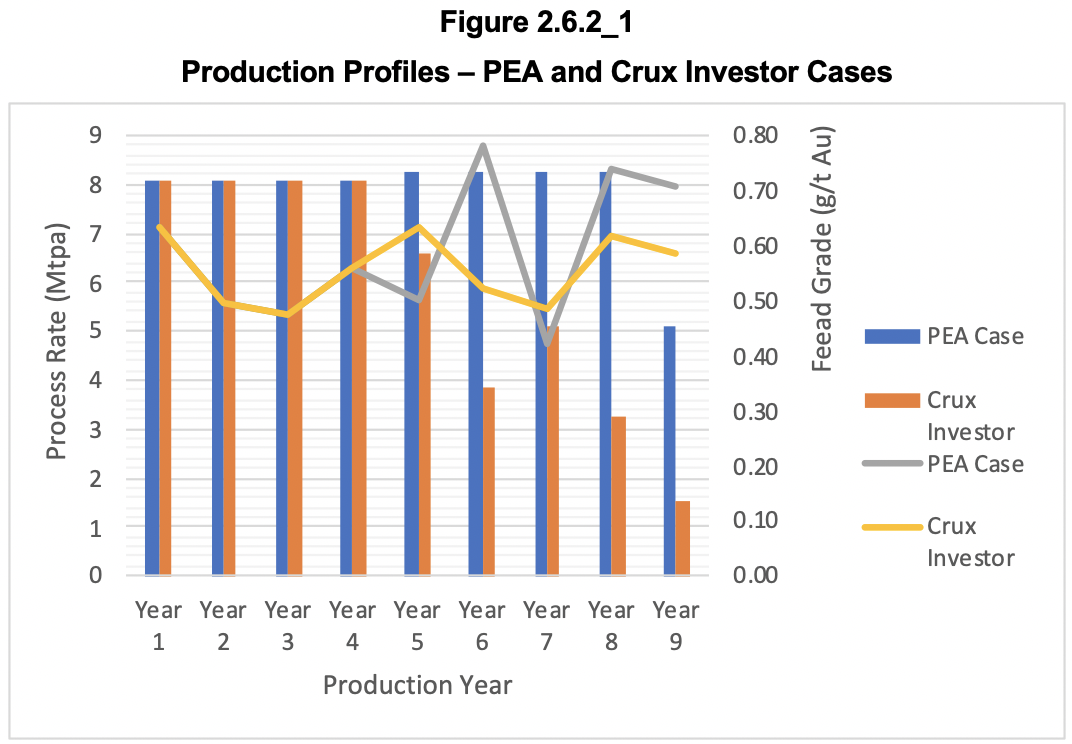
Total contained gold in the Crux Investor Case feed is 0.93 Moz compared to 1.40 Moz for the PEA Case. The technical report mentions that the annual production accounts for 15% of the annually stacked gold to be locked up, only to be released one year later. However, the annual gold production in the last production year does not reflect this. Crux Investor has been consistent and only released 15% of gold stacked in Year 9 in Year 10.
Capital Expenditure
Table 2.6.3_1 shows the capital cost estimates for initial construction, sustaining capital expenditure including the construction of a crushing circuit in Year 4 and Year 5, and closure cost.
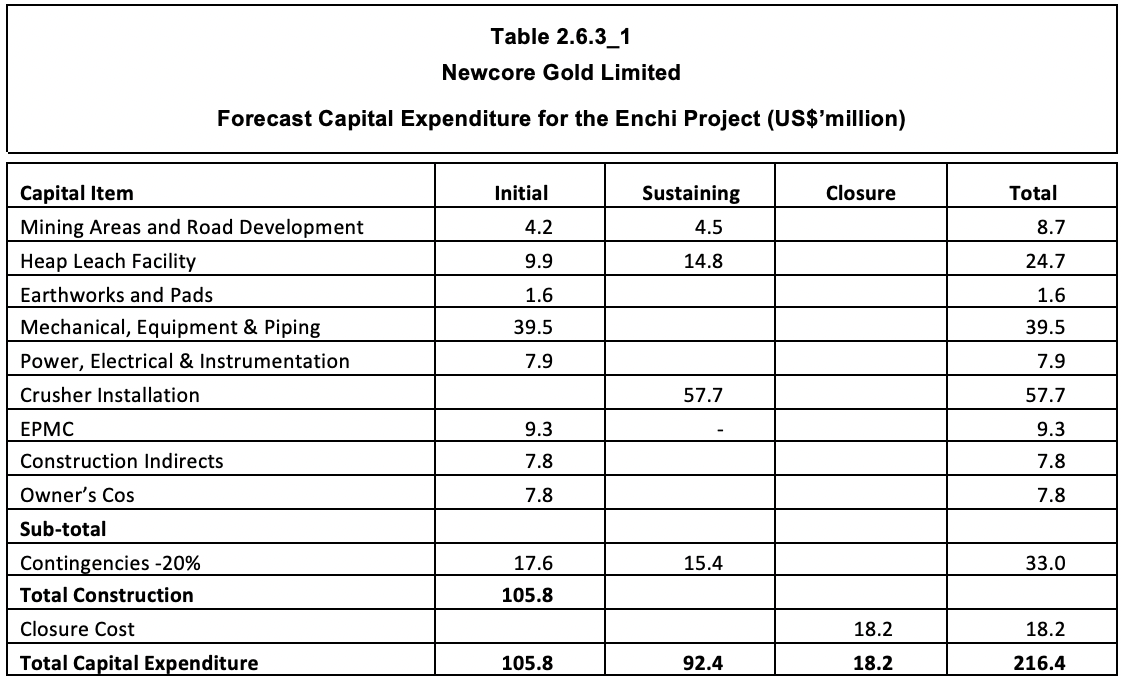
Specifically excluded from the estimation are the provision of power and the construction of a permanent camp.
The overall provisions look low, with heap leach pad construction implied to cost US$0.35/t stacking capacity. The EPCM provision converts to almost a 15% cost rate, which is reasonable but has not been applied to sustaining capex. Contingency has been applied to construction capital expenditures but not to closure expenses.
Despite the above, Crux Investor has adopted the forecast for its economic assessment, dropped the crusher capital expenditure, and proportionally reduced the heap leach pad expenditure for the Crux Investor Case.
Operating Expenditure
Table 2.6.4_1 reproduces the estimated operating cost as per PEA.
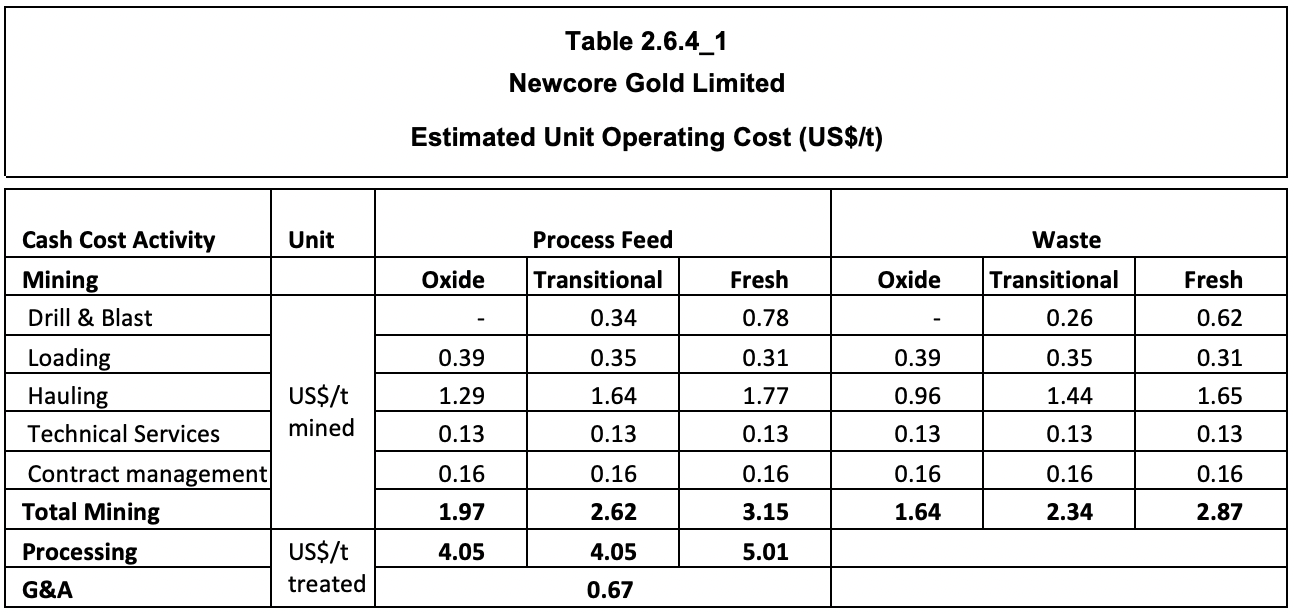
According to the PEA, the mining cost rate includes fuel and maintenance costs for mobile equipment. This contradicts the stated intention to use local contractors for mining, confirmed by the exclusion of mining equipment capital expenditure in Table 2.6.3_1. The mining cost rates should include the recoupment cost for the contractor acquiring such equipment plus a profit margin as a reward for services.
In general, the unit mining cost rates are too low. As usual, the technical report relies on “first principle” estimation without conducting a benchmarking exercise as a reality check. Crux Investor conducted an extensive benchmarking exercise for the Analyst’s Notes on Orezone published in January 2023 and an updated Analyst’s Notes in April 2024. Orezone is active in Burkina Faso, which is probably subject to a less wet climate than Ghana. The benchmarking with other mines active in Burkina Faso indicated very optimistic cost provisions in the Orezone’s FS on which the business plan was based. The Analyst’s Notes of January 2023 concluded that a rate of US$2.7/t for free dig material was more realistic when using a mining contractor. When drafting the April 2024 Analyst’s Notes, Crux Investor could draw on actual 2023 cost performance numbers for Orezone, which validated the conclusion of the benchmarking exercise being 59% higher than forecast.
Crux Investor concluded that a rate of US$2.5/t for free dig and US$3.5/t for material requiring drill and blasting was more realistic, and an annual G&A rate in excess of US$20 million. These rates have also been used for this valuation, but with G&A assumed to cease after 5 years.
The processing cost of US$4-5/t is very low compared to the actual leaching cost in the USA. Considering the need to agglomerate Oxide and Transitional material and the location in Ghana, which probably requires relying on diesel-generated power, Crux Investor used a rate of US$8.0/t.
As usual with project economic assessment in technical reports, the corporate overhead structure is ignored in calculating the net present value (“NPV”). Crux Investor has applied the cash expenses of US$2.9 million during 2024 on corporate management going forward.
Royalties and Taxes
The following royalties apply:
- Government royalty of 5%;-
- Triple Flag NSR royalty of 2%. The Crux Investor Case assumes an acquisition of 1% point for US$3.5 million.
According to the PEA income taxes are 35%, but after allowing amortisation and depreciation of capital expenditure at a rate of 20% annually. What the PEA ignores is that there is a withholding tax of 8% on dividends. Furthermore, the 10% free-carried interest of the Ghanaian government is also ignored.
Results
Table 2.6.6_1 summarises the LOM results for the PEA Case and Crux Investor Case.
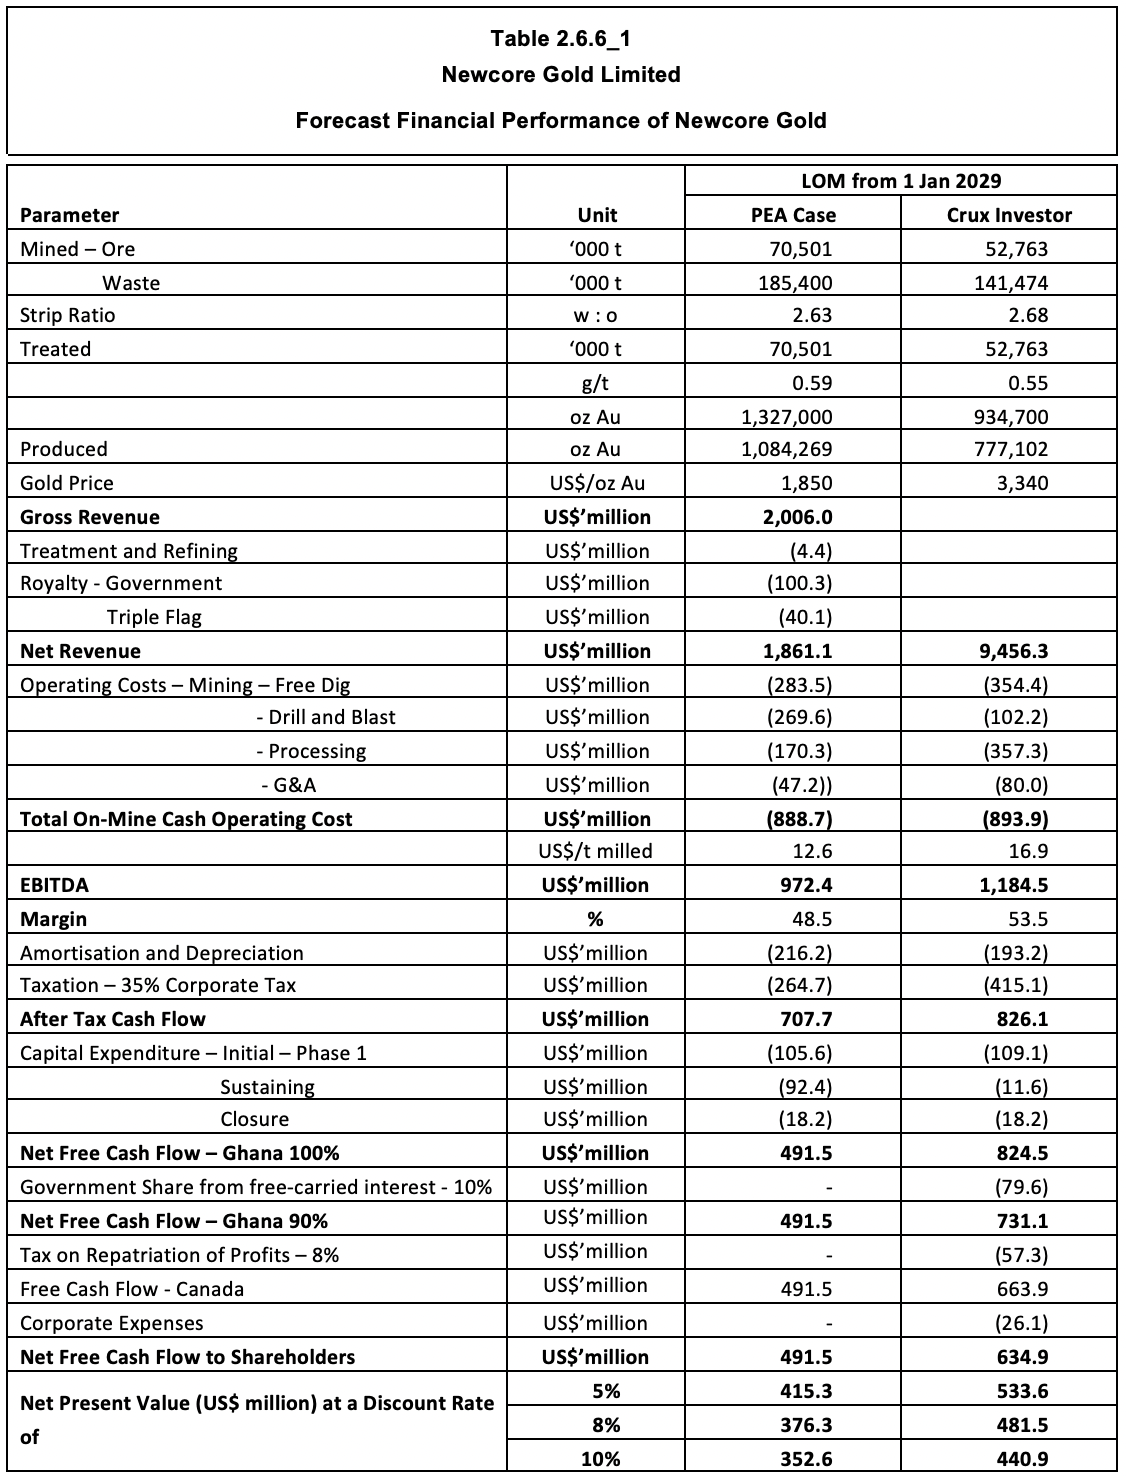
Using the PEA parameters, Crux Investor arrives at US$491 million net free cash flow compared to US$506 million in the PEA. As this is less than 3% difference, the model can be considered in close agreement. Somewhat strangely, the PEA states that the NPV5 is US$371 million, which is closer to the NPV8 calculated by Crux Investor. This points to a typing mistake in the PEA. For project evaluation, discounting at 8% is more appropriate than 5%. With a very short LOM, time value of money is not material, and the various NPV’s are very similar.
The Crux Investor case arrives at a much better NPV8, US$482 million, despite including additional taxes and charges. The much higher gold price is very forgiving, further supported by a lower NSR royalty rate and inclusion of US$53.6 million sunk exploration and evaluation expenses as of 31 March 2025 allowed against taxes.
The government's 10% free carried interest absorbs almost US$80 million free cash flow, and the tax on repatration of funds another US$57 million. The very modest annual corporate expenses reduce net free cash flow by US$26 million.
Table 2.6.6_2 expresses the sensitivity of the value of Newcore as the change in NPV’s per percentage point change in the main parameters: metal prices, operating expenditure, and capital expenditure.
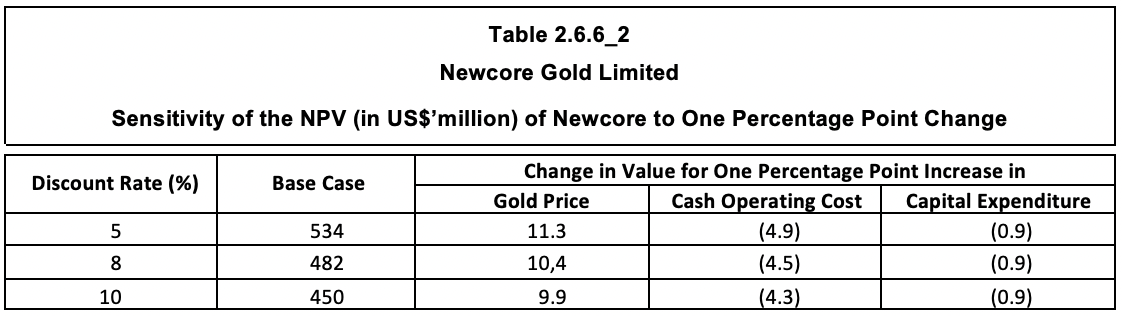
The sensitivity analysis demonstrates the very robust nature of the Enchi project, with the NPV8 increasing by only 2.2% (US$10.4 million) for every percentage point increase in the gold price and dropping by only 0.9% (US$4.5 million) for every percentage point increase in operating cost (i.e. US$0.17/t processed).
Should the LOM be extended, an additional year would increase the NPV8 by around US$85 million. The above valuation is based on resources established by drilling up to the end of 2022 and for Nyam at the end of 2021. Much exploration has been carried out since then, and the next section will investigate to what extent additional LOM is probable.
Exploration And Testwork Results Since PEA
In June 2024, the company announced the commencement of a 10,000 m drilling programme, which was increased in February 2025 to 35,000 m.
The drill results of five boreholes targeting the sulphide mineralisation at Nyam, announced on 16 August 2023, have been ignored as irrelevant until such time it has been proven that heap leaching can economically extract gold.
Since the release of the PEA, there has been one press release with additional test work results. However, it only deals with column leach results for Oxide material from trenches at Sewum and Boin. Five of the seven composite samples were derived from Sewum and two from Boin. Mineralisation can be considered the most oxidised when extracted from trenches. Moreover, the grain size is very fine, with, on average, more than 79% finer than 2.5 mm. This requires agglomeration with 10 kg Portland cement per tonne placed. Reported recoveries were excellent, averaging 93% and slumping was only 7%.
Interestingly the press release mentions “additional testing of sulphide mineralization is in progress consisting of bottle rolls and column tests, as well as additional testwork of rock properties such as bond work indices.” The results have yet to be released. Given the delay, this points to unpleasant surprises. Until positive heap leach results for Fresh mineralisation become available, Crux Investor remains of the opinion that sulphide mineral resources should not have been estimated and included in the MRE statement. Only Oxide and Transitional resources are of relevance.
Table 3_1 summarises all the press releases with the results of the 35,000 m reverse circulation campaign released up to July 2025.
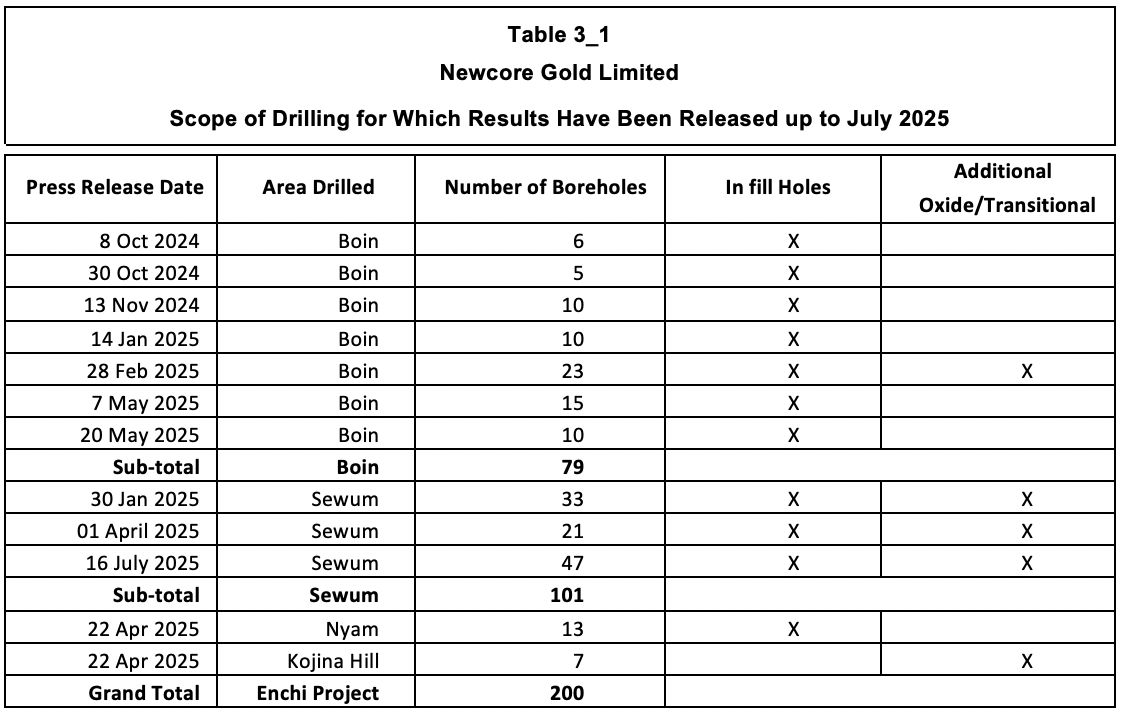
It goes beyond the scope of this report to reproduce all drill results, but below are some illustrations to provide the reader with a better insight into the scope of drilling. They demonstrate that it is dominantly aimed at increasing the confidence level of the resources in preparation for an FS. There are a few examples of holes that add to the Oxide/Transitional resources.
Figure 3_1 contains the latest drill collar location plan for Boin, illustrating that the holes were almost exclusively drilled within the resource pit outlines, except for the holes outlined by the blue circle. In other words, these holes provided infill information for shallower ground and possibly resource expansion, but this will be for sulphide mineralisation, which can be ignored at this stage
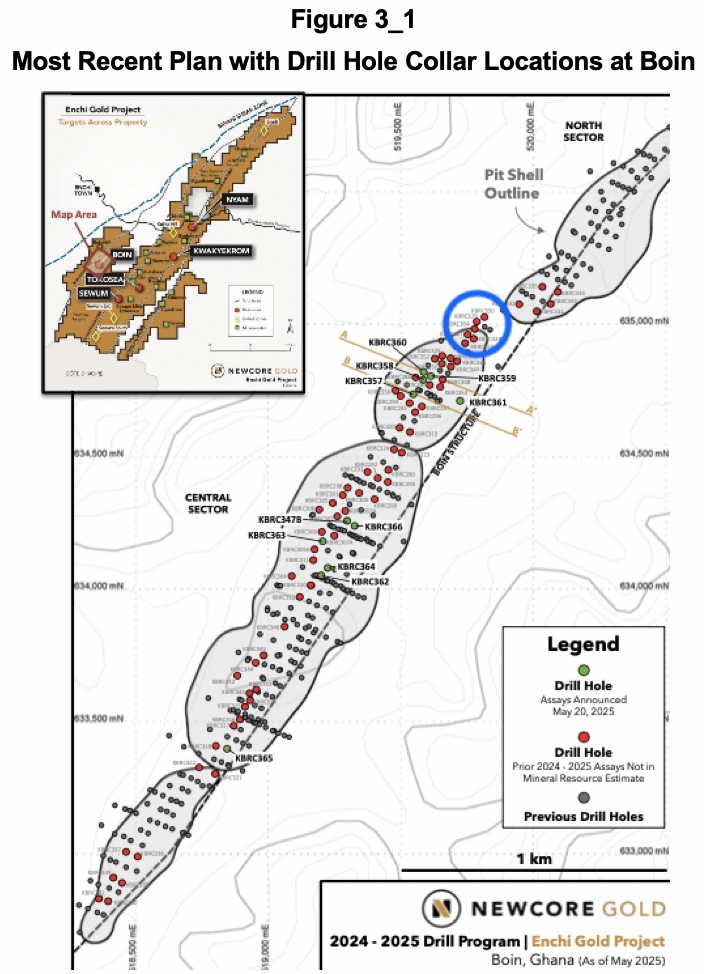
For the area shown as the blue circle, the 28 February 2025 press release includes the cross section reproduced in Figure 3_2 demonstrating Oxide Zone mineralisation below the resource pit outline. However, also note that the pit outline to the left is not supported by grades in hole 327.
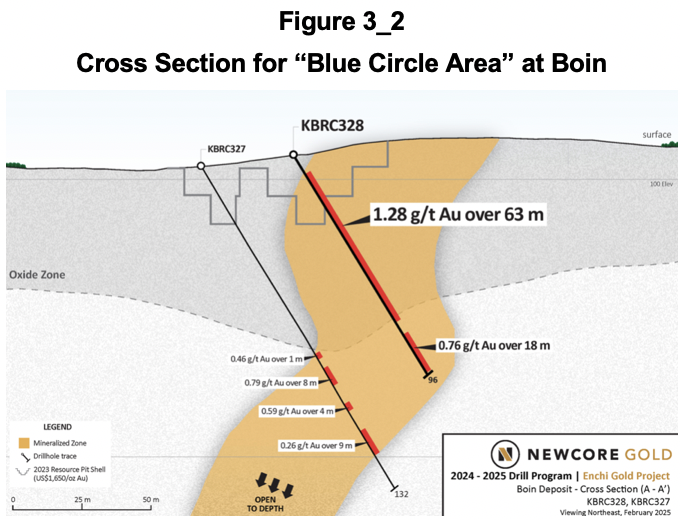
Figure 3_3 contains the cross sections A-A’ and B-B’ in the 14 November 2024 news release to demonstrate the dominantly in-fill nature of the holes.
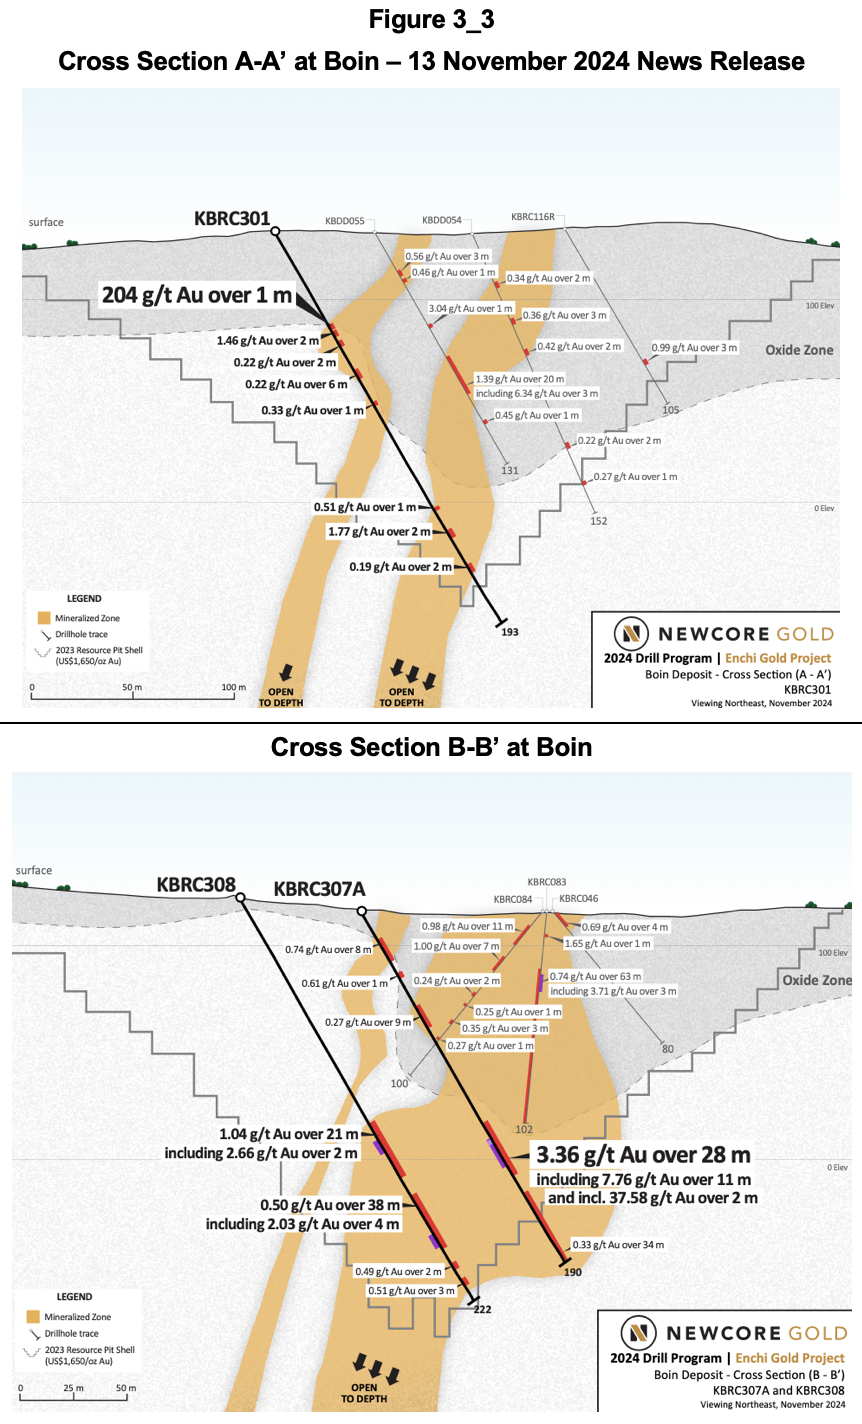
The two sections are approximately 125 m apart and show very different results. The intersections on A-A’ are very underwhelming, being very narrow and with very low grade except for one very high grade over one metre and one 20 m intercept with 1.30 g/t Au. Section B-B’ has much broader intercepts, but in fresh rock.
Figure 3_4 contains the most recent drill hole collar location plan for Sewum published on 16 July 2025.
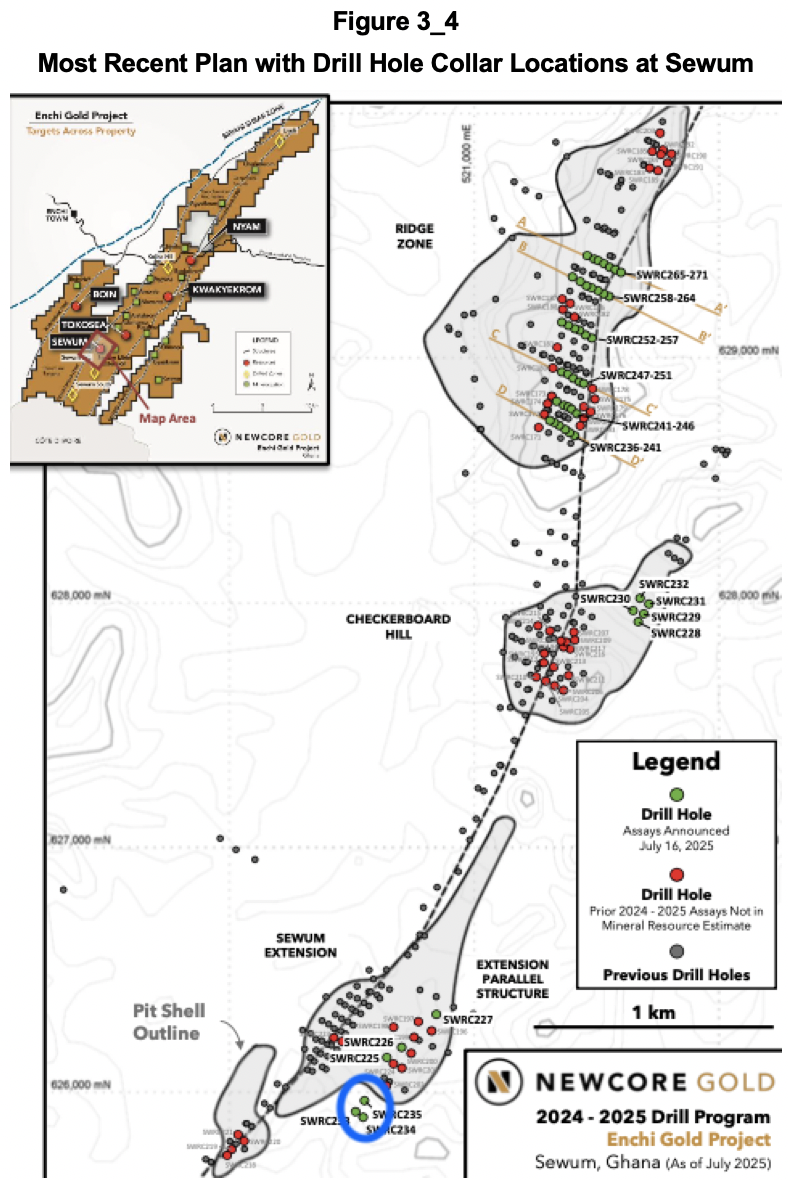
None of the holes shown outside pit outlines were part of the current drilling campaign, except for the three holes circled in blue. Unfortunately, the reported results for these holes are poor.
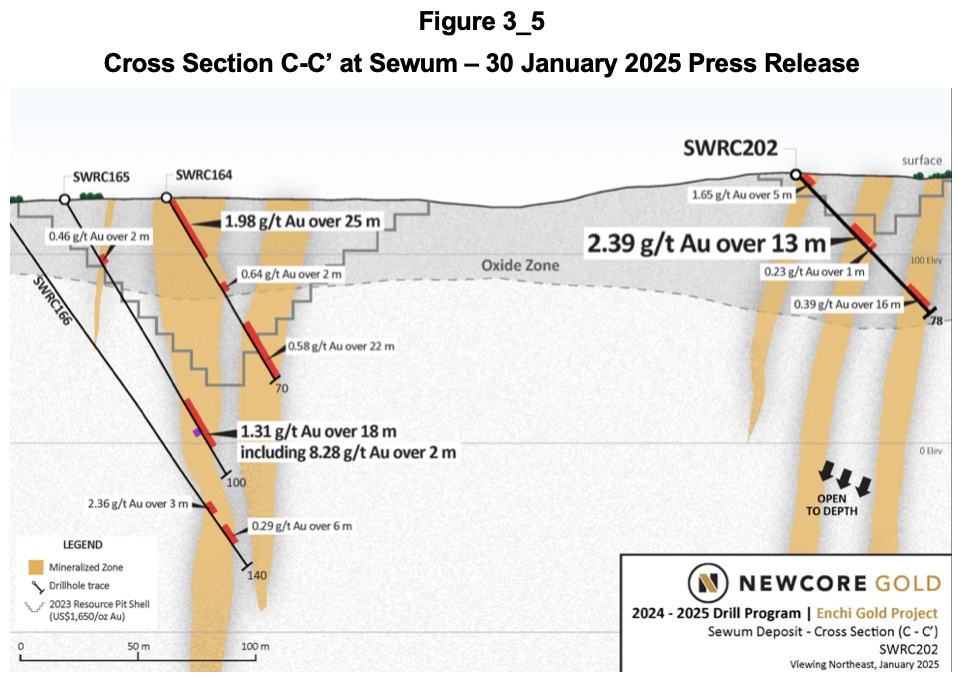
The 30 January 2025 press release includes a cross-section C-C’ that adds to information on oxidised mineralisation outside a pit outline (see Figure 3_5). Holes 164 and 165 pre-date the drilling campaign and do not provide new information.
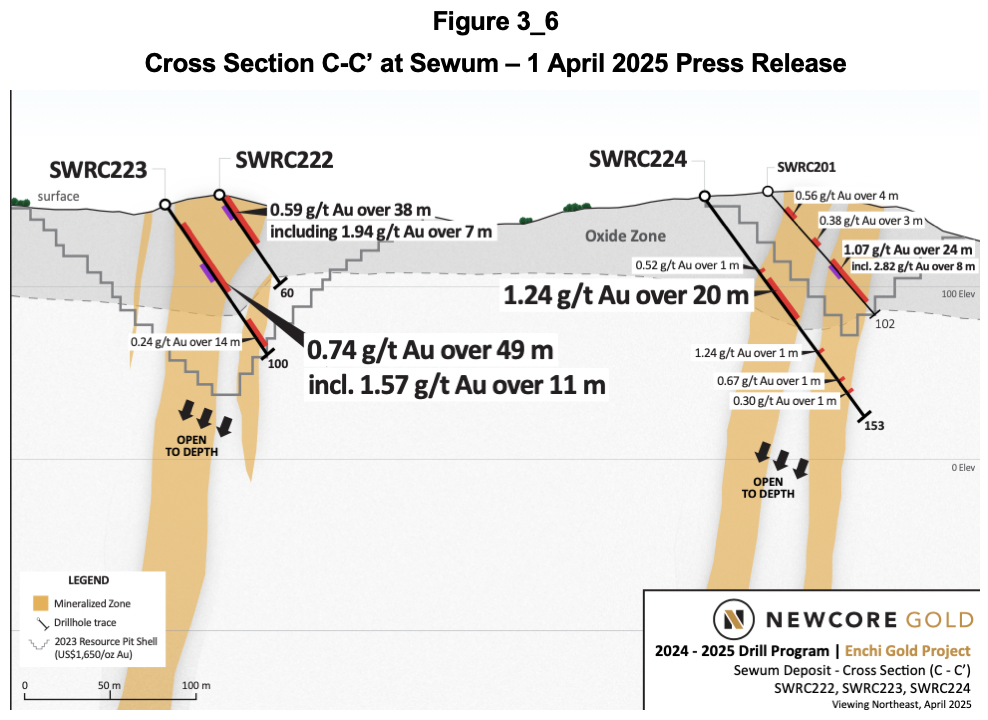
The press release on 1 April 2025 contains cross section C-C’ below in Figure 3_6 with hole 224 containing 1.24 g/t Au over 20 m in Oxide/Transitional mineralisation below a resource pit.
The press release dated 22 April reports on 13 holes at Nyam without adding to Oxide and Transitional resources. It also gives results for seven holes at Kojina Hill, which were not part of any mineral resource estimation. The top of fresh mineralisation is here, however, shallow at approximately 35 m.
In conclusion, a careful review of all drill hole results shows that very little additional Oxide and Transitional resources can be expected from the current drilling campaign. The benefit may be an updated MRE confirming the current overall resources, but at a higher confidence level and hopefully at the same higher, or a higher, average grade than currently established.
As it stands, no additional LOM can be expected, and there is no reason to amend the valuation in Section 2.6.6.
Executive Summary
Newcore Gold Limited (“Newcore”) (TSX:NCAU) is a Canadian company that is advancing the Enchi gold project in Ghana, which is one of the best jurisdictions in western Africa. The diluted Enterprise Value on 17 July 2025 was US$98 million. With declared mineral resources of 1.72 million ounces (“Moz”) this equates to US$58/oz, which at 1.7% of the spot gold price looks low. It has caught the attention of Crux Investor and is the reason for this valuation report.
Newcore’s involvement in Enchi started in May 2014 when it entered into an agreement to earn a 100% interest in the project, the acquisition completed in December that year. Progress has not been as quick as the project already had declared mineral resources of 0.77 Moz in 2012, growing to 1.25 Moz in 2020 and which was the subject of a preliminary economic assessment (“PEA”) in 2021. The latest technical report, dated 7 June 2024, again reports on the findings of a PEA, this time with 1.72 Moz gold in mineral resources, 43% of which are classified as Indicated resources.
The updated mineral resource estimation (“MRE”) dated January 2023, on which the 2024 PEA was based, seems to have been well received, as the share price has been rising ever since.
The Enchi project is located in southwest Ghana on the border with the Ivory Coast. It is moderately well serviced by infrastructure, but the connection to the powergrid is at some distance. The 248 km2 tenement area covers 40 km of the Sefwi greenstone belt, a geological environment prospective for gold deposits controlled by thrust and fault structures. At Enchi the major structures are named from west to east, the Bibiani Shear (“BS”), the West Sewum Shear (“WSS”), and the Nyam Shear (“NS”). Numerous targets have been defined along these shears and their splays, but the most important are in the Sewum, Boin and Nyam areas and to a much lesser extent Kwakyekrom and Tokosea. Here, mineralisation is within zones of varying width that are sub-parallel to the fault structures.
For the MRE, three-dimensional wireframes for each mineralised zone were designed using criteria that included a minimum downhole width of 1 m and a minimum grade of 0.2 g/t gold. For Sewum, six zones were defined, containing 30 domains. Boin comprises 10 zones, almost all sub-parallel. The lodes within these zones vary from narrow (Zones 7-10) to wide (Zone 5). Nyam comprises six sub-parallel zones. The other deposit areas are not discussed in this report as these contain, at this stage, negligible resources.
Mineral resource statements are provided with a breakdown per area showing that Sewum, Boin and Nyam account for 91.6% of the gold contained, and with a breakdown for the oxidation stage. The problem Crux Investor has with this breakdown is that the technical reports fail to give proper definitions for the classification of mineralisation as Oxide, Transitional and Fresh. The illustrations also only provide an indication of the depth of the boundary between “the Oxide Zone” with Fresh.
Metallurgical test work has yet to prove that mineralisation in Fresh rock is amenable to heap leaching. However, the derivation of the cut-off grade for Fresh resources assumes such. This is a leap of faith that cannot be endorsed by Crux Investor and considers the numbers for Fresh mineralisation as invalid. Dropping out fresh rock mineral resources reduces the amount of gold contained to 1.0 Moz.
With almost 57% of the gold contained in Inferred Resources, it did not make sense to commission a feasibility study (“FS”) to declare mineral reserves, so a PEA was completed. This allows Inferred resources to be included in the business plan. The total material in such a plan can be referred to as Mineable Inventory.
The technical report provides the pit optimisation results for each of the deposit areas and, separately, a breakdown of these as Mineable Inventory of Oxide, Transitional, and Fresh material. A comparison between Mineral Resources and Mineable Inventory indicates that for Oxide and Transitional, respectively, 94% and 92% of contained gold are assumed converted at grades that are 12% and 10% higher. Given the often narrow nature of the lodes, this is unlikely in practice, as some degree of mining and internal dilution will apply.
The plan is to mine the deposits by conventional open pit operation, utilising an outside contractor employing small-scale equipment to drill and blast material, load, and haul mineralised material to a heap leach facility and the waste to nearby dump locations. All the Oxide and a considerable proportion of the Transitional resources are considered free-dig material. A heap leach facility halfway between the two largest deposits, Sewum and Boin, will process the Mineable Inventory.
Metallurgical test work indicates that the plant feed will have a large component of very fine material, requiring agglomeration with Portland cement at an application rate of 10 kg/t to give permeability and stability to the heaps and prevent slumping. Very rapid and high gold leach extractions are indicated for Oxide and Transitional material. After discounting for field-scale up, the average gold extraction rate was discounted to an average recovery of 88.6% for Oxide/Transition material. Crux Investor records a risk associated with the suggested recovery for Oxide/Transitional as the samples were predominantly drawn from trenches (= highest oxidation level) and of very fine material (= best liberation of gold grains).
This report has analysed two scenarios: the PEA Case, adopting all the inputs from Newcore to verify the accuracy of the Crux Investor model, and the Crux Investor model with inputs considered more realistic and incorporating charges ignored in the PEA. The most important differences are the removal of Fresh material from the production schedule and using the spot gold price at US$3,340/oz, instead of US$1,850/oz in the PEA Case.
The capital expenditure provisions in the PEA were given the benefit of the doubt and adopted despite being deemed optimistic. Operating costs were definitely too low, which Crux Investor based on a benchmarking exercise it completed for its Analyst’s Notes on Orezone in January 2023 and April 2024.
The results of the cash flow model for the PEA Case show almost the same net free cash flow, confirming a NPV8 of US$371 million. Despite dropping out the Fresh mineralisation from the production schedule, applying much higher unit operating cost, accounting for the 10% free-carried interest of the government, an 8% withholding taxes on repatriation of profits and corporate overheads in Canada, the Crux Investor Case arrives at a much higher NPV8 of US$482 million. The much higher gold price is very forgiving.
The cash flow model indicates that for every additional year life of mine (“LOM”) the NPV8 value would increase by US$85 million. For this reason, Crux Investor has carefully reviewed all drill results since the release of the PEA. Newcore provides a full set of results for all drill holes completed, including clear illustrations where these holes were drilled and many cross sections to provide context for the results. It exemplifies how exploration results should be released to the market. It allowed Crux Investor to gain good insight into the scope of work and what was achieved. From the review, it is clear that the aim is to convert resources to a higher confidence level category and that very little additional Oxide/Transitional resources can be expected from this drilling campaign.
This means that the valuation of US$482 million remains applicable. As a rule of thumb, at the PEA stage, a company trades at 0.2-0.3 x the NPV. Applied to Newcore, this would translate to US$96 million—US$145 million. With further de-risking, these numbers should increase.
In conclusion, Newcore Gold is not a bad investment opportunity.
Introduction
Newcore Gold Limited (“Newcore”) (TSX:NCAU) is a Canadian company that was incorporated in 2010 under the name Pinecrest Resources Limited, but changed its name to the current one in August 2020. Newcore engages principally in the advancement and development of the Enchi gold project in southwest Ghana.
The Enchi project has had a long history of exploration by various operators, including Leo Shield Exploration Ghana NL (“Leo Shield”) from 1995 to 1998, Redback Mining Inc. (“Red Back” now part of Kinross) from 2003 to 2010, Edgewater Exploration Ltd. (“Edgewater”) from 2011 to 2013, and Newcore Gold Ltd. (Newcore) from 2014 to present. Newcore’s involvement started in May 2014 when it entered into an agreement to earn a 100% interest in the project, the acquisition completed in December that year.
Progress has not been fast as the project area already had declared mineral resources of 0.77 Moz in 2012, growing to 1.25 Moz in 2020 which was the subject of a PEA in 2021. The latest technical report, dated 7 June 2024, again reports on the findings of a PEA, this time with 1.72 Moz gold in mineral resources, 43% of which classified as Indicated resources.
Currently the company is completing a 35,000 m drilling campaign, which is “focused on resource growth and infill drilling designed to convert inferred mineral resources to indicated mineral resources”. The objective is to commission a pre-feasibility study (“PFS”) in H2 2025.
At a share price of C$0.57 on 17 July 2025 Newcore’s market capitalisation was C$145 million. At 31 March 2025 the company had a cash balance of C$14.8 million, sufficient to cover the cash burn rate of the Q1 2024 quarter for three more quarters. The diluted Enterprise Value on 17 July 2025 was C$144 million (US$98 million) with all warrants and almost all share options in the money. The share price performance since early 2024 explains why these are now in the money, refer to Figure 1_1.
The Enterprise Value values mineral resources at US$57/oz. This does not seem onerous, which is why Crux Investor decided to investigate the company and its project further.
Valuation of the Enchi Project
Background
The information in Sections 2.1 to 2.6.5 of this report is derived from a NI.43-101 compliant technical report dated June 2024, authored by Lycopodium, reporting on the findings of a PEA.
The project area is located 290 km west of the capital of Accra and the town of Enchi is located 10 km to the west (see Figure 2.1_1).
The project can be accessed from Accra on sealed roads via the regional port city of Sekondi (Takoradi) or the mining centre of Kumasi. From either of these centres, a paved road leads to the town of Enchi. Access through the remainder of the project area is by dirt and gravel roads.
Enchi is located 77 km north of the substation at Elubo, serviced by a 225 kV line, and 122 km southwest of the substation at Asawinso, serviced by a 161 kV line.
The Enchi tenement area includes six prospecting licenses and three applications for prospecting licenses, comprising a total of 248 km2 land package. Figure 2.1_2 shows the shape and extent of the tenement area.
The tenements cover a 40 km strike length of the eastern margin of the Sefwi Belt stretching from the Ivory Coast border in the southwest to neighbouring claims to the northeast.
Triple Flag Precious Metals Corp. holds a 2% net smelter returns royalty (“NSR”) on the project's production (with 1% subject to a buy-back option for a lump sum payment of US$3.5 million at any time held by Sandstorm Gold Ltd.). The government levies a 5% royalty on revenues.
Geology and Mineralisation
The Sefwi Belt is dominated by mafic volcanics, metasediments, and intrusive granitoids that are sandwiched between sedimentary basins. The belt is traceable for 260 km along strike and is usually 30 km to 60 km wide. The metavolcanic and metasedimentary sequences are believed to be contemporaneous, with the sediment deposited in basins eroded from the adjacent volcanic terrains.
Extensive faulting occurs along the margins of the volcanic-sediment belts. Observed at local and regional scales, these northeast-trending structures are fundamentally important in the development of gold deposits for the region. The primary shear system within the Enchi concession at the Sefwi Belt and Kumasi Basin's boundary is the Bibiani Shear Zone. Gold deposits are located in third-order structures that splay-off the second-order structures and are sub-parallel to the overall trend of the Bibiani Shear Zone. The Bibiani Shear Zone has been traced for 40 km on the Project area. Major structures within the Project are named from west to east, the Bibiani Shear (“BS”), the West Sewum Shear (“WSS”), and the Nyam Shear (“NS”). Figure 2.2_1 shows the various shear zones in relation to the tenement area and the most advanced targest indicated by red stars. Of these Sewum is the most important in terms of mineral resources, followed by Boin and then Nyam.
The Sewum prospect is found along the eastern contact of a thrust-bounded volcanic sliver, outcropping 6 km to the east of the Boin Zone on the BS. Sewum is situated along several major thrust zones that crop out across the regional 3 km wide north-south corridor. Figure 2.2_2 shows a schematic cross section showing the zones with mineralisation in a yellow colour.
The Sewum Shear Zone represents a major regional structure that can be traced 25 km south from where it branches off the Bibiani Shear Zone. The shear has a complex anastomosing geometry with numerous splays and has played a major role in localising gold mineralisation in the Sewum area. Striking north-northeast, the Sewum Shear is typically vertical to steep west-dipping and can be up to 100 m wide.
The presence of the dolerite body within the Sewum Shear Zone is significant in that the intrusive represents a more competent rock type compared to the surrounding sediment and is more likely to deform in a brittle manner during faulting and deformation, potentially making a more permeable host to mineralisation. Mineralised breccia and stockworking are commonly found along the margin of the dolerite dyke: the east contact zone (“ECZ”) and the west contact zone (“WCZ”).
The section above shows that one of the most significant zones of continuous gold mineralisation identified in drilling at Sewum is the Ridge Top Shears Zone (“RTSZ”), related to a series of close-spaced, moderately dipping shears up to 20 m thick hosted within a dolerite dyke.
At the Boin prospect the BS is one of several major structures that splay off the Bibiani Shear. It is interpreted as a thrust fault, dipping moderately west and is responsible for the development of the zone of mineralised quartz veins. It has been tested over 11 km at shallow depths over regular intervals. A generalised section is shown in Figure 2.2_3.
The whole contact is expressed as a 10 m to 30 m wide graphitic shear zone, which trends NNE to NE and dips west at 30 degrees to 70 degrees.
The Nyam Zone strikes over a distance of 2.1 km, and is 200 m to 300 m west of the interpreted position of the second-order NS structure. The zone of mineralisation lies in the hanging wall of a northeast-striking shear that dips 70 to the east and is up to 30 m thick. An extensive envelope of weak gold mineralisation (more than 0.25 g/t) dips sub-vertically and strikes NE.
Figure 2.2_4 contains a schematic cross-section through Nyam.
Mineralisation at the Nyam Zone is composed of veined and brecciated sediment and lesser intrusive rocks cemented by quartz, ankerite (Ca(Fe,Mg,Mn)(CO3)2), and albite. It has been traced continuously by trenching and drilling for over 2 km strike length.
On the three cross sections above, the depth of oxidation is shown, above which the sulphides have been turned to oxide minerals, and liberated the gold from the sulphides. This is a critical economic aspect of the deposits, as will be discussed in later in Metallurgy and Processing Operations - Metallurgical Test Work.
Mineral Resources and Mineral Reserves
Mineral Resources
The mineral resources in the PEA simply adopted the estimation carried out by BBA E&C incorporated (“BBA”), which became effective on 26 January 2023 after a review by SEMS Exploration Services Ltd (“SEMS”). A review of the BBA technical report indicates that the cut-off dates for inclusion in the MRE are generally the end of 2022 and even the end of 2021 for Nyam. Given the scope of work since then, the MRE can be considered outdated.
Mineralised wireframe outlines for each of the deposits were created by sectional digitising of mineralisation on 25 m to 200 m intervals. Drillhole spacing is variable but with most of the surface drilling collared on 25 m to 75 m sections. Three-dimensional wireframes for each mineralised zone were designed using criteria that included a minimum downhole width of 1 m and a minimum grade of 0.2 g/t gold. However, due to the variable geometry of mineralisation and to provide continuity there are portions within some wireframes that have grades less than 0.2 g/t Au. The model extends the wireframes where the mineralisation was not considered closed off. Despite classifying these to contain Inferred resources only, Crux Investor deems this a risky approach.
For Sewum, six zones were defined, containing 30 domains. Boin comprises 10 zones, almost all sub-parallel. The lodes within these zones vary from narrow (Zones 7-10) to wide (Zone 5). Nyam comprises 6 sub-parallel zones. The other deposit areas can be ignored as having negligible resources for the purposes on the MRE.
According to SEMS a composite length of 1 m was chosen (BBA states however a 2 m kength), which is short and indicative of the many narrow lodes. Grade capping was applied to composite grade assays. The table for the capped composite statistics does not provide the coefficient of variation (“CV”), but it does give means and variance from which the reader can derive CV’s. These are generally low, which is good.
Variography was carried out for Sewum, Boin and Nyam and the results presented in table form. No semi variograms are presented, leaving the reader to simply accept the results. This is, in the opinion of Crux Investor, unacceptable. It is up to the Competent Person to demonstrate the reasonableness of the assumption used.
A block size of 10 m x 10 m x 10 m was selected to accommodate the nature of the mineralisation and to be amenable for potential open pit mining. Sub-cells of 2.5 m x 2.5 m x 2.5 m were used to estimate the wireframes' volume. For Boin the sub cells were 1.25 m x 1.25 m x 1.25 m. Block grades were estimated using nearest neighbour, inverse distance to the power 2 (“ID2”), and ordinary kriging. Hard borders were used to prevent composites in a particular wireframe informing on block grades in another wireframe.
Low unit cost rates were used for the reasonable prospect of eventual economic extraction (“RPEEE”), but this is more than compensated for by a very low gold price of US$1,650/oz. More seriously, metallurgical recoveries for treating fresh rock were used, which are totally unsupported by metallurgical test work (refer to Metallurgy and Processing Operations - Metallurgical Test Work later in this report ).
Whereas the PEA report suggests an effective date of 24 April 2024, the mineral resources have an actual effective date of 26 January 2023. Table 2.3.1_1 and Table 3.2.1_2 show the declared mineral resources, which were effectively estimated by BBA, the top-most table with resources for each target area, and the second table resource per oxidation state.
The table shows that Sewum, Boin and Nyam account for almost 92% of the gold contained in total resources.
The table indicates that almost 59% of the contained gold is present in Oxide and Transitional material, with Oxide alone acconting for more than 27%. This is surprisingly much considering the shallow level at which the maximum depth of the Oxide zone is indicated in the three cross sections above, varying between 50 m and 75 m.
It does not help that nowhere in the geological discussion clear definitions were given for classifying Oxide, Transitional and Fresh. In particular a proper definition of Transitional is missing.
Moreover, Table 14.3.2 of the 2024 technical report gives the number of samples used to establish the specific gravity for material by oxidation stage with 98 used for Oxide, 794 for Transitional, and 2,751 for Fresh. Either measurements were taken very much biased towards Fresh material, or the definition for oxidation stage was used very inconsistently.
The technical report gives excellent visual verification providing numerous cross sections comparing block grades with borehole intersection grades. Below is such a cross section for the Sewum Ridgetop area, also illustrating that the top of fresh rock is approximately at 50 m depth with Oxide accounting for slightly more than half that depth. For scale, use the coordinates along the top.
The cross section below is for Boin Central showing the top of fresh rock again at a depth of approximately 50 m and again with Oxide reaching to half that depth.
Figure 2.3.1_3 contains the cross section through the Nyam block model with fresh rock again at approximately 50 m depth and the depth of Oxide material a bit more than half this distance.
Crux Investor rates the discussion about oxidation stage and their (lack of) definition in the technical report as being very unsatisfactory, in particular, in the light of the economic significance of the oxidation stage (see Section 2.5.1).
Mineable Inventory
With almost 57% of the contained gold in Inferred Resources it did not make sense to declare Mineral Reserves by carrying out a Feasibility Study (FS) and a Preliminary Econommic Assessment (PEA) was therefore completed. This allows Inferred resources to be included in the business plan. The total material in such a plan can be referred to as Mineable Inventory.
Pit optimisation has used a very low gold price of US$1,650/oz and taken account of the applicable royalties, used reasonably conservative pit slope angles, low unit costs for mining, processing and general and administration (“G&A”) expenses, has ignored dilution and assumed very low mining losses of 4%. The assumed metallurgical recovery was 85% for Oxide and Transitional material, 75% for Fresh.
The technical report provides the results of the pit optimisation for each of the deposit areas and, separately, a breakdown of these Mineable Inventories as Oxide, Transitional and Fresh material.
Table 3.2_1 combines both breakdowns to verify the internal consistency of the numbers provided.
Comparison between Mineral Resources and Mineable Inventory indicates that for Oxide and Transitional respectively 94% and 92% of contained gold are assumed converted at grades that are 12% and 10% higher. Given the often narrow nature of the lodes, this is unlikely in practice as mining and internal dilution will apply.
With reference to Section 2.5.1, which will demonstrate that there is no basis to assume Fresh material to be economically amenable to heap leaching, no such mineral resources should have been declared, and no mineable inventory is applicable. The implication is that gold contained in the life of mine (“LOM”) plant feed should be dropped by one-third.
Mining Operations
The plan is to mine the deposits by conventional open pit operation, utilising small scale equipment to drill and blast material, load, and haul mineralised material to a heap leach facility and the waste to nearby dump locations. Mining will be conducted across nine open pits in 10 m bench increments. Contract mining has been assumed.
Figure 2.4_1 shows the various pits and the location of the planned heap leach facility between the two largest resource areas: Sewum and Boin.
Oxide material will be free dug by hydraulic excavators without requiring any drilling or blasting. It is “assumed” (= not very confidence inspiring) that the upper 50% of transition material is sufficiently broken and may be free dug as well. The bottom 50% of transition material is considered competent and will be drilled and blasted along with all fresh material.
Metallurgy and Processing Operations
Metallurgical Test Work
The discussion about metallurgical test work differs considerably in the 2023 MRE technical report and 2024 PEA report, with the former giving more detail.
Much of the test work is irrelevant to supporting heap leaching with much bottle roll testing and with column leaching of material that is much finer than envisaged for the production process. For example, the 2nd Phase Column Leach Test carried out in October 2022 on two composites of Sewum and one from Boin had almost three-quarters finer than 2 mm and calculated head grades much higher than the resource grades, averaging 0.75 g/t Au. After agglomeration, the samples were found to leach fast and with a high extraction rate, averaging 92.4%. Reagent consumption was low. The 2023 MRE report concludes that “column leach tests confirm that gold extraction via cyanidation is generally good for the oxide and transition domains of the Boin, Sewum and Kwakyekrom deposits”. Note that this excludes fresh material and the Oxide and Transitional material for Nyam.
The 2024 PEA report also includes testwork results subsequent to the MRE report. Tests in 2022 – 2023 at the University of Mines and Technology (UMaT) in Tarkwa, Ghana confirmed previous heap leach results.
In 2023 Oxide material from trenches at Boin and Sewum, again with very fine material requiring agglomeration and with much higher grades than the mineral resources were tested for gravity separation and subjected to column leaching. Gravity concentration proved relatively ineffective. Column leach recoveries averaging 91.7% were excellent, but slumping averaged 15.4%, which is above industry standards.
In August 2023, composites of fresh rock at Nyam were tested, but not for heap leaching. In the same month, Oxide material from trenches at Tokosea was tested by bottle roll leaching. From this Crux Investor concludes that there seems to be no systemic approach to the metallurgical test work to reach firm conclusions about heap leaching the resources.
Also in 2023, trench samples at Boin and Sewum were selected for bulk-scale pilot heap testing over 60 days. The samples consisted of blended Oxide material with individual samples and composites “covering a range of gold grades”. The report omits to provide average grades for these samples. The agglomerated composites were leached, yielding overall recoveries in excess of 90%. After discounting for field-scale up, the average gold extraction rate was discounted to an average recovery of 88.6% for Oxide/Transition material. There is risk associated with the suggested recovery for Oxide/Transitional, as the samples were predominantly drawn from trenches and of very fine material. No grades were provided compared to the resource grade. The application of discounts to the results mitigates to some extent the risk.
For the purposes of this report, only test work that is focused on heap leaching is of relevance. The report specifically mentions that no column tests were completed for any sulphide samples. Yet, the report suggests an average recovery of 75% for Sulphide mineralisation. Crux Investor rejects this leap of faith and rejects this number as totally unsubstantiated. No mineral resources should have been estimated for Fresh mineralisation until this is resolved.
Processing
Run-of-mine (“ROM”) material is assumed commuted, first in a primary mineral size to P80 minus -40 mm, followed by two-stage crushing to P80 minus 19 mm for transitional and fresh material. This is followed by agglomeration with cement and cyanide solution in a rotating drum, from which grasshopper conveyors and radial stackers will transport the material on the leach pad in 5 m lifts.
Cyanide solution will be applied to the heap at a rate of 10 l/m2/hr for a 40-day ‘transition’ period. This rate will then decrease to 7 l/m2/hr for a 40 -day period. Leaching of each cell will continue after the 70 days due to solution trickling down from the cell(s) above, and the cell will not be drained until reaching 90 days. The pregnant solution will be collected and exposed to activated carbon to capture the gold. The Zadra process will elute the gold from the carbon and the sludge treated by electrowinning and melted to a doré product.
Economic Valuation
Metal Prices Used and Scenarios Analysed
This study has considered two scenarios:
- Adopting the input parameters of the PEA to verify nothing has been overlooked and to what extent the income tax calculations are similar (“the PEA Case”). The gold price in the PEA is US$1,850/oz.
- Using inputs that Crux Investor considers more realistic, including charges ignored in the PEA, including sunk exploration and evaluation expenses for tax deduction and using the spot gold price on 17 July 2025: US$3,340/oz: the Crux Investor Case.
Net revenue is derived from gross revenue minus treatment and refining charges of US$4.0/oz sold and after deducting the government royalty of 5% and the royalty to Triple Flag. The PEA assumes 2%, but Crux Investor has assumed that Newcore will buy back 1% point for US$3.5 million before the start of production.
Production Schedule
The PEA provides an annual production schedule in its Table 16.5.2 with tonnages for Oxide, Transitional, Fresh and waste material together with total gold contained in the various mineralisation types. There is no mining during the one-year pre-production period, and processing is supposed to reach the steady state rate of 8.1 million tonnes per annum (“Mtpa”) in Year 1. During the period from Year 1 to Year 4, only Oxide and Transitional material is mined and treated. Year 5 is a year of transition with Fresh material supplementing Oxide and Transitional, after which only Fresh material is mined and treated.
The PEA Case fully adopted the provided schedule, but the Crux Investor Case ignored any contribution of Fresh material because it still needs to be proven to be amenable to economical heap leaching. The Crux Investor Case production profile, therefore, sees a drop off in annual treatment rate after Year 4 compared to the PEA Case (see Figure 2.6.2_1). In practice, the treatment rate would be maintained for a much shorter LOM. The diagram also shows the feed grade profile for both scenarios.
Total contained gold in the Crux Investor Case feed is 0.93 Moz compared to 1.40 Moz for the PEA Case. The technical report mentions that the annual production accounts for 15% of the annually stacked gold to be locked up, only to be released one year later. However, the annual gold production in the last production year does not reflect this. Crux Investor has been consistent and only released 15% of gold stacked in Year 9 in Year 10.
Capital Expenditure
Table 2.6.3_1 shows the capital cost estimates for initial construction, sustaining capital expenditure including the construction of a crushing circuit in Year 4 and Year 5, and closure cost.
Specifically excluded from the estimation are the provision of power and the construction of a permanent camp.
The overall provisions look low, with heap leach pad construction implied to cost US$0.35/t stacking capacity. The EPCM provision converts to almost a 15% cost rate, which is reasonable but has not been applied to sustaining capex. Contingency has been applied to construction capital expenditures but not to closure expenses.
Despite the above, Crux Investor has adopted the forecast for its economic assessment, dropped the crusher capital expenditure, and proportionally reduced the heap leach pad expenditure for the Crux Investor Case.
Operating Expenditure
Table 2.6.4_1 reproduces the estimated operating cost as per PEA.
According to the PEA, the mining cost rate includes fuel and maintenance costs for mobile equipment. This contradicts the stated intention to use local contractors for mining, confirmed by the exclusion of mining equipment capital expenditure in Table 2.6.3_1. The mining cost rates should include the recoupment cost for the contractor acquiring such equipment plus a profit margin as a reward for services.
In general, the unit mining cost rates are too low. As usual, the technical report relies on “first principle” estimation without conducting a benchmarking exercise as a reality check. Crux Investor conducted an extensive benchmarking exercise for the Analyst’s Notes on Orezone published in January 2023 and an updated Analyst’s Notes in April 2024. Orezone is active in Burkina Faso, which is probably subject to a less wet climate than Ghana. The benchmarking with other mines active in Burkina Faso indicated very optimistic cost provisions in the Orezone’s FS on which the business plan was based. The Analyst’s Notes of January 2023 concluded that a rate of US$2.7/t for free dig material was more realistic when using a mining contractor. When drafting the April 2024 Analyst’s Notes, Crux Investor could draw on actual 2023 cost performance numbers for Orezone, which validated the conclusion of the benchmarking exercise being 59% higher than forecast.
Crux Investor concluded that a rate of US$2.5/t for free dig and US$3.5/t for material requiring drill and blasting was more realistic, and an annual G&A rate in excess of US$20 million. These rates have also been used for this valuation, but with G&A assumed to cease after 5 years.
The processing cost of US$4-5/t is very low compared to the actual leaching cost in the USA. Considering the need to agglomerate Oxide and Transitional material and the location in Ghana, which probably requires relying on diesel-generated power, Crux Investor used a rate of US$8.0/t.
As usual with project economic assessment in technical reports, the corporate overhead structure is ignored in calculating the net present value (“NPV”). Crux Investor has applied the cash expenses of US$2.9 million during 2024 on corporate management going forward.
Royalties and Taxes
The following royalties apply:
- Government royalty of 5%;-
- Triple Flag NSR royalty of 2%. The Crux Investor Case assumes an acquisition of 1% point for US$3.5 million.
According to the PEA income taxes are 35%, but after allowing amortisation and depreciation of capital expenditure at a rate of 20% annually. What the PEA ignores is that there is a withholding tax of 8% on dividends. Furthermore, the 10% free-carried interest of the Ghanaian government is also ignored.
Results
Table 2.6.6_1 summarises the LOM results for the PEA Case and Crux Investor Case.
Using the PEA parameters, Crux Investor arrives at US$491 million net free cash flow compared to US$506 million in the PEA. As this is less than 3% difference, the model can be considered in close agreement. Somewhat strangely, the PEA states that the NPV5 is US$371 million, which is closer to the NPV8 calculated by Crux Investor. This points to a typing mistake in the PEA. For project evaluation, discounting at 8% is more appropriate than 5%. With a very short LOM, time value of money is not material, and the various NPV’s are very similar.
The Crux Investor case arrives at a much better NPV8, US$482 million, despite including additional taxes and charges. The much higher gold price is very forgiving, further supported by a lower NSR royalty rate and inclusion of US$53.6 million sunk exploration and evaluation expenses as of 31 March 2025 allowed against taxes.
The government's 10% free carried interest absorbs almost US$80 million free cash flow, and the tax on repatration of funds another US$57 million. The very modest annual corporate expenses reduce net free cash flow by US$26 million.
Table 2.6.6_2 expresses the sensitivity of the value of Newcore as the change in NPV’s per percentage point change in the main parameters: metal prices, operating expenditure, and capital expenditure.
The sensitivity analysis demonstrates the very robust nature of the Enchi project, with the NPV8 increasing by only 2.2% (US$10.4 million) for every percentage point increase in the gold price and dropping by only 0.9% (US$4.5 million) for every percentage point increase in operating cost (i.e. US$0.17/t processed).
Should the LOM be extended, an additional year would increase the NPV8 by around US$85 million. The above valuation is based on resources established by drilling up to the end of 2022 and for Nyam at the end of 2021. Much exploration has been carried out since then, and the next section will investigate to what extent additional LOM is probable.
Exploration And Testwork Results Since PEA
In June 2024, the company announced the commencement of a 10,000 m drilling programme, which was increased in February 2025 to 35,000 m.
The drill results of five boreholes targeting the sulphide mineralisation at Nyam, announced on 16 August 2023, have been ignored as irrelevant until such time it has been proven that heap leaching can economically extract gold.
Since the release of the PEA, there has been one press release with additional test work results. However, it only deals with column leach results for Oxide material from trenches at Sewum and Boin. Five of the seven composite samples were derived from Sewum and two from Boin. Mineralisation can be considered the most oxidised when extracted from trenches. Moreover, the grain size is very fine, with, on average, more than 79% finer than 2.5 mm. This requires agglomeration with 10 kg Portland cement per tonne placed. Reported recoveries were excellent, averaging 93% and slumping was only 7%.
Interestingly the press release mentions “additional testing of sulphide mineralization is in progress consisting of bottle rolls and column tests, as well as additional testwork of rock properties such as bond work indices.” The results have yet to be released. Given the delay, this points to unpleasant surprises. Until positive heap leach results for Fresh mineralisation become available, Crux Investor remains of the opinion that sulphide mineral resources should not have been estimated and included in the MRE statement. Only Oxide and Transitional resources are of relevance.
Table 3_1 summarises all the press releases with the results of the 35,000 m reverse circulation campaign released up to July 2025.
It goes beyond the scope of this report to reproduce all drill results, but below are some illustrations to provide the reader with a better insight into the scope of drilling. They demonstrate that it is dominantly aimed at increasing the confidence level of the resources in preparation for an FS. There are a few examples of holes that add to the Oxide/Transitional resources.
Figure 3_1 contains the latest drill collar location plan for Boin, illustrating that the holes were almost exclusively drilled within the resource pit outlines, except for the holes outlined by the blue circle. In other words, these holes provided infill information for shallower ground and possibly resource expansion, but this will be for sulphide mineralisation, which can be ignored at this stage
For the area shown as the blue circle, the 28 February 2025 press release includes the cross section reproduced in Figure 3_2 demonstrating Oxide Zone mineralisation below the resource pit outline. However, also note that the pit outline to the left is not supported by grades in hole 327.
Figure 3_3 contains the cross sections A-A’ and B-B’ in the 14 November 2024 news release to demonstrate the dominantly in-fill nature of the holes.
The two sections are approximately 125 m apart and show very different results. The intersections on A-A’ are very underwhelming, being very narrow and with very low grade except for one very high grade over one metre and one 20 m intercept with 1.30 g/t Au. Section B-B’ has much broader intercepts, but in fresh rock.
Figure 3_4 contains the most recent drill hole collar location plan for Sewum published on 16 July 2025.
None of the holes shown outside pit outlines were part of the current drilling campaign, except for the three holes circled in blue. Unfortunately, the reported results for these holes are poor.
The 30 January 2025 press release includes a cross-section C-C’ that adds to information on oxidised mineralisation outside a pit outline (see Figure 3_5). Holes 164 and 165 pre-date the drilling campaign and do not provide new information.
The press release on 1 April 2025 contains cross section C-C’ below in Figure 3_6 with hole 224 containing 1.24 g/t Au over 20 m in Oxide/Transitional mineralisation below a resource pit.
The press release dated 22 April reports on 13 holes at Nyam without adding to Oxide and Transitional resources. It also gives results for seven holes at Kojina Hill, which were not part of any mineral resource estimation. The top of fresh mineralisation is here, however, shallow at approximately 35 m.
In conclusion, a careful review of all drill hole results shows that very little additional Oxide and Transitional resources can be expected from the current drilling campaign. The benefit may be an updated MRE confirming the current overall resources, but at a higher confidence level and hopefully at the same higher, or a higher, average grade than currently established.
As it stands, no additional LOM can be expected, and there is no reason to amend the valuation in Section 2.6.6.
To read the FULL report, for FREE, please subscribe below.
- Notification By Email When Our Latest Notes Are Published With Immediate Access As Soon As They Go "Live"
- Suggest Future Companies To Be Analysed (Launching Soon)
- Additional Related Notes and "How To's" To Aid You On Your Investment Journey.
Already a subscriber? Sign in


