Executive Summary
Arizona Sonoran Copper Company (“ASCC”) (TSX:ASCU) is a Canadian company aiming to achieve mid-tier copper production status by developing the Cactus Project in Arizona, USA. This project is located at the former ASARCO’s Sacaton mine that processed 38 million tonnes (“Mt”) of primary ore from 1974 to 1984. The Cactus project now comprises the site of the old mine (now known as Cactus West) and the Parks/Salyer deposit, located 2 km southwest of Cactus West. The mineralisation is a copper porphyry affected by weathering, which has resulted in a leached cap, below which the copper minerals occur as oxide, and below which there is a zone where copper has been enriched and is present as acid-soluble sulphide minerals. Below the enriched zone, the mineralisation is present as fresh rock (also known as hypogene mineralisation), and the copper is present in its original form: chalcopyrite (CuFeS2).
Crux Investor reviewed ASCC in an Analyst’s Notes published in February 2023. The technical information at the time was presented in a Preliminary Economic Analysis (“PEA”) completed in 2021. The business plan was complex, involving the mining of a waste dump reclassified as “Stockpile”, an open-pit mine, and an underground mine. Processing envisaged two separate heap leach operations, one for oxide material, another for enriched material.
The Analyst’s Notes piece was not very complimentary about the 2021 PEA. For example, it was found that the amount of material to be mined exceeded stated resource estimates in key areas, metallurgical testwork was partial, incomplete, and poorly explained, and forecast metallurgical recoveries were overly optimistic. Despite these concerns, Crux Investor concluded that fundamentally, the overall Cactus project was encouraging. Using several more conservative assumptions in addition to the basic parameters provided by the PEA, Crux Investor arrived at an NPV8 of $445 million. At a copper price of $4.09/lb, the project was found to be robust with a cash operating margin of 55%.
Since 2023, there have been significant developments and numerous additional studies. Notably, the Parks/Salyer deposits were intensively explored, and later, the MainSpring area to the immediate south was also explored. This tremendously boosted the amounts of mineral resources. It attracted the attention of a subsidiary of Rio Tinto, Nuton LLC, which has a proprietary leaching technology which may add value to the project. An option agreement was concluded with Nuton, with its prospective stake varying from 35% to 40% depending on how much its technology would add value to the project.
ASCC has continued developing business plans in a 2024 prefeasibility study (“PFS”), followed by a 2024 PEA and finally a PFS that was published in November 2025. The studies show a progressive simplification of the business plan, with the latest study having dropped underground mining and using a single process route for all mineralisation types. In the opinion of Crux Investor, this has considerably reduced the risks associated with the Cactus project. The November PFS assumes standard acid heap leaching followed by solvent extraction (“SX”) and electrowinning (“EW”) of the copper to produce directly saleable copper cathodes. In December, Nuton will need to complete its PFS to demonstrate the extent to which its process can add value.
Crux Investor has attempted to independently reproduce the business case and model the future cash flow. It has found it very hard going. It is as if the technical report intentionally makes it difficult, if not impossible, for an outside party to come to grips with the project. There are numerous contradictions and inconsistencies in the information, as well as a general lack of detail. This also had an impact on the quality of the report. Crux Investor has picked up many mistakes. For example, with a change in format of the mineral reserve statement compared to the mineral resource statement, there is a substantial drop in total copper grade (“CuT”) of Measured Resources (0.67%) at Cactus West to Proven Reserves (0.30%).
One irritating inconsistency is the change in focus from soluble copper grade (“CuSol) in the discussion of mineral resource estimation (“MRE”) and metallurgical testwork to production schedule and life-of-mine (“LOM”) recoveries expressed in CuT.
The lack of information provided can also not be explained solely by a desire to keep the report brief. There is a lengthy discussion on the MRE of the stockpile, as well as an extensive discussion about metallurgical testwork. Considering that the Stockpile does not feature in the production schedule, it is totally irrelevant.
ASCC would benefit from appointing a technical person to oversee feasibility studies, ensuring that all parties are aligned and minimising inconsistencies and errors.
Crux Investor has made considerable effort to model the business case of ASCC, in particular to verify whether its tax model arrives at a broadly similar amount. After all, taxes are one of the main cash drains, exceeding LOM capital expenditure. The total taxes calculated by Crux Investor were found to be gratifyingly very close, being only 2.5% higher.
Crux Investor has also input the annual cash flow amounts extracted from a very rudimentary cash flow table in the technical report to verify the LOM royalty, the sequencing of expansion and sustaining capital expenditure and the calculation of the net present value (“NPV”).
For its own business case, Crux Investor has adopted all inputs, except where there are obvious mistakes, such as the inclusion of a provision for land acquisition that has already been secured, resulting in a 0.5% increase in royalties. After a benchmarking exercise, Crux Investor has substantially increased operating cost rates. Importantly, the PFS does not consider the construction of an acid plant. This would imply transport of enormous quantities of acid instead of sulphur. It would significantly add to operating costs. The issue is nowhere discussed. Crux Investor has included a provision of US$400 million for such a plant.
The Crux Investor case has used the spot copper price of US$5.05/lb, which is much more favourable than the US$4.25/lb in the PFS. The net effect is still a great drop in NPV8 from US$1.73 billion for PFS cash flow to US$0.92 billion. The NPV8 of US$2.30 billion quoted in the technical report is objectively incorrect, as it is based on an erroneous application of the NPV formula, which would typically yield a lower result. The conventional discounting of negative cash flow is, however, incorrect, as such a return is not earned on negative amounts. Given the long payback periods of five years for the PFS case and six years for the Crux Investor case, ignoring discounting of negative cash flows has a significant impact on the results.
The diluted Enterprise Value of 2 December 2025 is US$601 million, or 65% of the calculated NPV8.
However, with the possibility of Nuton exercising its option, no direct conclusions can be made about whether ASCC currently constitutes good value. Based on the qualifying criteria, exercising the Nuton option would reduce the value of the remaining stake for ASCC by between 16% and 22%. This implies that ASCC is better off with Nuton not being able to exercise. It is therefore in ASCC’s interest to pitch the NPV of its current NPV as high as possible. It raises the question: “Does Nuton need to endorse the validity of the 2025 NPV and the reasonableness of the business plan, as well as all its inputs?”
However, even when reducing the current NPV8 derived by Crux Investor by 22% as a worst-case scenario, this would bring the value for ASCC down to US$719 million, still above the current Enterprise Value.
ASCC remains good value.
Introduction & Study Progress Since The Previous Analyst's Notes
Arizona Sonoran Copper Company (“ASCC”) (TSX:ASCU) is a Canadian company aiming to achieve mid-tier copper production status by developing the Cactus and Parks/Salyer deposits in Arizona, USA. Cactus was formerly ASARCO’s Sacaton mine that processed 38 million tonnes (“Mt”) of primary ore from 1974 to 1984.
Following the acquisition of the old mine and its associated waste dumps in 2020, ASCC initiated technical studies and exploration. The waste dumps contain oxide material that had been reclassified as a Stockpile Resource. Other resource areas initially included the old Cactus West open-pit area and underground potential at Cactus East. A 2021 Preliminary Economic Analysis (“PEA”) outlined a 17-year staged operation. The PEA development sequence started with the Stockpile while preparing the old open-pit, then mining at the Cactus Mine West open pit, and finally opening the Cactus Mine East underground. The Analyst’s Notes piece, published in March 2023, was highly critical of the poor quality of the 2021 PEA study. For example, the amount of material to be mined – the Mineable Inventory – exceeded stated resource estimates in key areas. Metallurgical testwork was partial, incomplete, and poorly explained. Forecast metallurgical recoveries were aggressive. Acid consumption forecasts were inconsistent with test work. Operating cost estimates from the PEA were too low. Despite these shortcomings, Crux Investor found the overall project encouraging and the economics robust at a copper price of US$4.09/lb. The company traded at the time well below the NPV8 figure of US$445 million arrived at by Crux Investor.
Since the 2021 PEA, the company carried out substantial additional drilling of the Parks/Salyer deposit to the southwest of Cactus West and of the Cactus East deposit to the northeast of Cactus West. In addition, extensive metallurgical testwork was conducted, and the company evaluated the amenability of the mineralisation to treatment using Rio Tinto’s NutonTM technology.
In February 2023, ASCC agreed to acquire the MainSpring property, which is contiguous to the Parks/Salyer property, and began drilling there in October after the land was rezoned for industrial use.
In October 2023, the company could declare an updated mineral resource estimate (“MRE”) more than tripling the contained copper in the Measured and Indicated (“M&I) categories at a grade that was 9% higher. The results of Nuton™ testing were reportedly very encouraging, also judging from the fact that Rio Tinto and ASCC entered into a joint venture in December 2023, under which Nuton could acquire between 35% and 40% in the project, depending on the degree to which the estimated NPV using the technology would exceed the NPV without this process.
In February 2024, the results of the PFS were released, indicating an NPV8 of US$0.51 billion. Crux Investor records that the reserves for mining the underground section of Cactus again far exceeded those of M&I Resources (i.e., 27.7 Mt at a 0.95% TCu grade versus 10.4 Mt at a 0.88% TCu grade). It seems that Ausenco did not learn from its previous poor reporting.
The March 2024 PFS was rapidly superseded by another PEA report dated August 2024, this time published under the auspices of M3 Engineering but using the same consultants for mineral resources and mineral reserves. It is therefore not surprising that the production schedule included almost 2.5x the mineral resources tonnage at Cactus underground in the plant feed. It appears that the peer review of the technical reports related to the Cactus project were either cursory or non-existent.
The main difference between the two studies was the change in scope from underground mining in the PFS to open-pit mining in the PEA for Parks/Salyer. Moreover, being a PEA allowed the inclusion of Inferred resources in the mine plan, which increased the amount processed by 222%, dropped the TCu grade by 24%, resulting in 145% more TCu contained in the feed. Apart from benefiting from the Inferred Resources, the PEA also used much higher conversion rates than the PFS. Whereas the PFS converted 34% of the tonnage of the Cactus Open Pit Indicated resources to reserves and 61% of Parks/Salyer, the PEA converted 81% of the total resources’ tonnage from Cactus Open Pit to plant feed and 85% from Parks/Salyer open pit. No wonder the NPV8 improved from US$509 million in the PFS to US$2,032 million in the PEA.
In October 2024, ASCC initiated another PFS study, this time with M3 Engineering as the lead consultant.
In January 2025, Hudbay Minerals Incorporated (“Hudbay”) took a strategic stake in the company by investing C$20 million. A subsidiary of Royal Gold acquired an existing royalty of 2.5% from Tembo Capital in February 2025 for US$55 million.
In November, the PFS was published. It differs from the PEA by ignoring the treatment of the Stockpile, assuming open-pit mining solely, and dramatically reducing the life-of-mine (“LOM”) plant feed to 513 Mt, compared to 889 Mt in the PEA. The peak production plant throughput was decreased from 31 Mt per annum (“Mtpa”) to 28 Mtpa. The net effect was the reduction of the LOM from 31 years to 20 years. This Analyst’s Notes will review the business plan in this report.
Location And Mineral Tenements
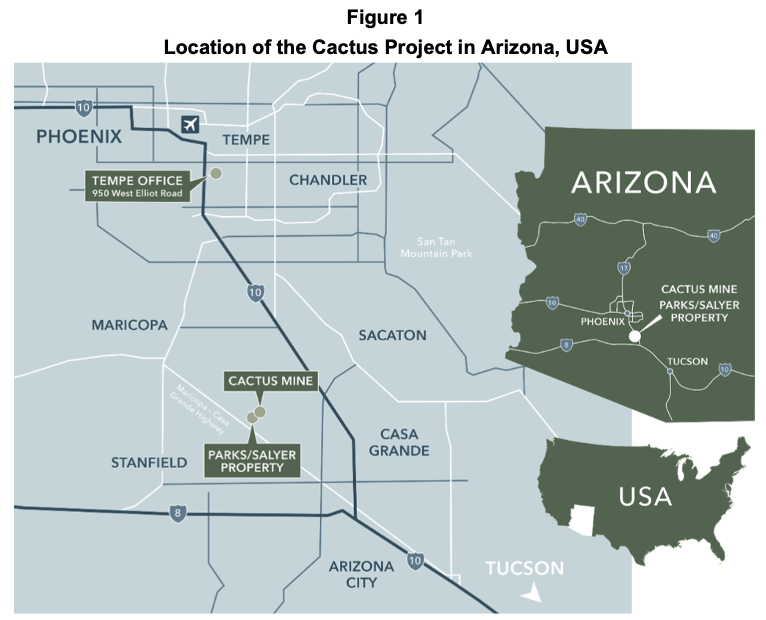
The project area is located 40 road miles south-southeast of the Greater Phoenix metropolitan area and approximately 6 miles northwest of the city of Casa Grande, Pinal County, Arizona (see Figure 1). The area is well serviced by infrastructure.
Immediately to the southwest, Cactus abuts the start of Ivanhoe Electric Inc.’s (“Ivanhoe Electric”) Santa Cruz claims. Ivanhoe Electric is a US$2.1 billion exploration and development company with a number of assets, including the flagship Santa Cruz copper deposit.
The total tenement area is currently approximately 7,843 acres. The project is subject to four royalties based on potential mining production, some of which are subject to an option to a partial repurchase. The discussion of these royalties is too unclear to model their effect. Crux Investor records that the LOM royalty payments, as per the PFS, amount to 1.8% of revenue, increasing from nil in Production Year 1 to a peak of 2.60% in Production Year 12. This rate seems to exclude an additional 0.5% rate granted to the owners of 2,203 acres of land recently purchased on production from this land. The agreement was concluded on 29 August 2025, well before the completion of the PFS.
Geology And Mineralisation
The Cactus project's hard rock deposits are copper porphyries which have been displaced in a north-easterly direction along a shallow-dipping Basement Fault. The Basement Fault has, in turn, been affected by cross-cutting faults, resulting in the deposits present in “horst” blocks. Horsts are raised fault blocks.
Figure 2, below, shows a plan view with the location of deposits along the northeast/southwest-trending mineralised corridor. The cross-section A-A’ is a good illustration of the deeper Santa Cruz deposit to the southwest, followed by Parks/Salyer in the middle, and the Cactus West open pit profile visible on the right of the section. Cactus East mineralisation is the deeper portion on the very edge of the cross-section.

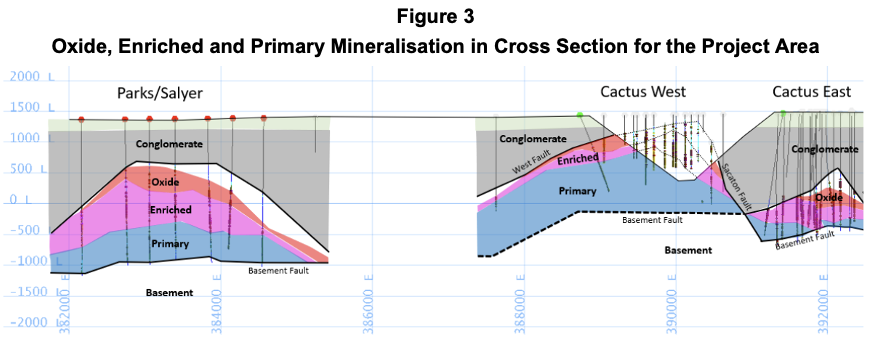
The geology in the area has a history of oxidation and leaching through weathering. Both the Cactus and Parks/Salyer deposits are characterised by a zonation that varies with depth. At the top, there is a Leached zone devoid of copper, followed by an Oxide zone and a subsequent Enriched zone. The weathered zones have overly fresh mineralisation. See Figure 3, below, for a cross-section through the deposits to illustrate this zonation.
In the Oxide zone, copper is predominantly present as chrysocolla, brochantite and malachite. Chrysocolla is a hydrated copper silicate, brochantite is a copper sulphate, and malachite is a copper carbonate. All three minerals are acid-soluble and can be leached to produce a high-purity copper cathode with conventional hydrometallurgical processing such as solvent-extraction / electro-winning (“SX/EW”).
In the Enriched zone, copper is largely present as chalcocite and in the primary zone as chalcopyrite. Both are sulphides. Chalcocite is especially copper-rich, and it is cyanide soluble and can be partially leached by sulphuric acid to produce a high-purity copper cathode in an SX/EW plant.
Chalcopyrite readily upgrades to copper-sulphide concentrates, but cannot be leached by sulphuric acid under atmospheric conditions.
Mineral Resources
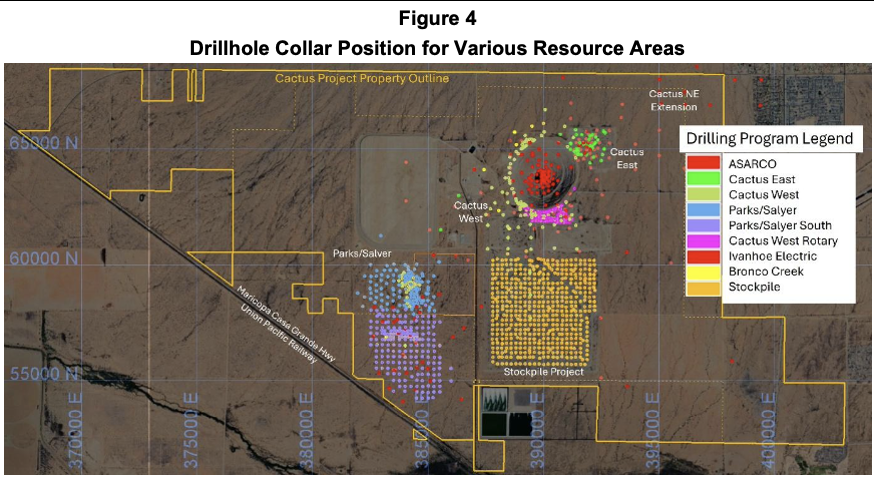
Mineral resources were estimated for Cactus, open-pit resources for Cactus West and underground resources for Cactus East, Parks/Salyer and the Stockpile. For the Cactus project, a database of 743 holes is available, including 560 holes drilled since 2019. The resource estimate for the Cactus deposits is supported by 363 holes. The Parks/Salyer database contains 296 holes. It makes for an impressive drill density, as is shown in Figure 4.
The estimation domains are based on their weathering status: Leached, Oxide. Enriched and Fresh, see Figure 3. These distinctions are based on logging of the type of copper mineral and sequential copper assaying: acid-soluble analysis (“CuAs”) followed by cyanide-soluble (“CuCN”) analysis, which together determine total soluble copper (“Tsol”) grade. Total copper (“CuT”) assay was also carried out.
As shown in Figure 2 and Figure 3, the mineralised units are enclosed between basement units and overlying conglomerate/alluvium. Figure 5 shows the Oxide (red outline), Enriched (purple outline) and Fresh (blue outline) rock domains on a section through the various deposits.

Assaying was typically conducted on 3 m lengths; therefore, a composite length of 6 m was chosen, which aligns well with the envisaged 12 m pit block size. Contacts between the various copper mineral domains were treated as hard, meaning that grades in one particular domain would not inform on the grade of blocks in another domain.
Based on histogram and log normal cumulative probability plots for CuT, ASCu, CuCN, and Tsol in each of the mineral zones, grade capping levels were determined.
Although variogram analysis was conducted for each domain, the technical report does not provide illustrations of how well-defined these are. The nugget effects are generally low, between 5% and 18%, and the search radii are large, typically exceeding hundreds of metres. The parent block size for grade estimation was chosen at 36.6 m x 36.6 m x 36.6 m with sub-blocking of 6 m x 6 m x 6 m to honour geological and topographic contacts. Block grades were estimated by ordinary kriging. The estimations for Cactus West and Cactus East were carried out separately.
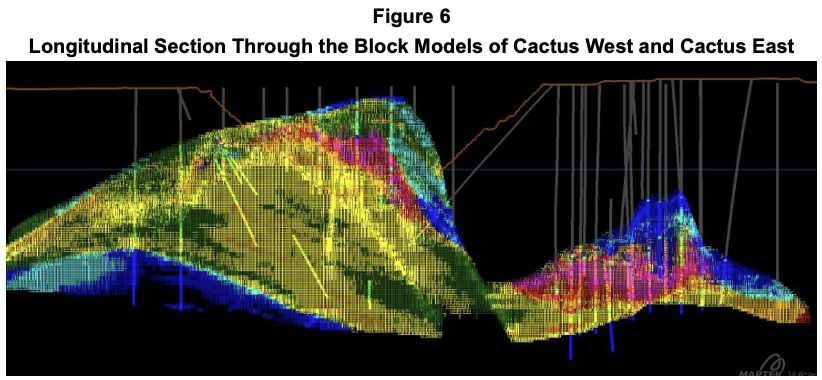
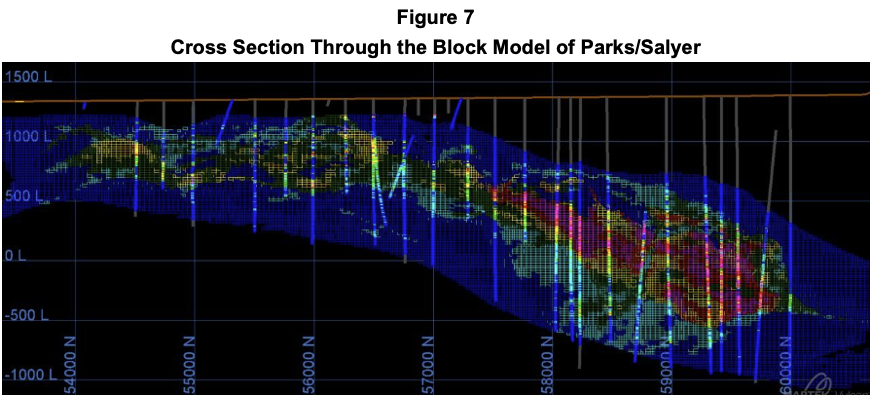
The illustrations comparing block grades with drill intersection grades show an impressively good correlation, as evident in Figure 6 for Cactus and Figure 7 for Parks/Salyer.
The technical report also includes a long discussion (more exhaustive than for hard rock mineral resource estimation) on the resource estimation for the Stockpile, which is far less convincing than the estimation of the in-situ resources. The discussion has been deemed irrelevant by Crux Investor, as the Stockpile is not part of the business plan.
To comply with the reasonable prospect of eventual economic extraction (“RPEEE”) criterion, cut-off grades were determined “based on a high-level cost analysis”, a copper price of US$4.20/lb, and metallurgical recoveries discussed in Metallurgical Test Work later in this report. The cut-off grades expressed in Tsol grade vary from 0.079% to 0.087% for the various types of mineralisation and deposits.
Table 1 gives the mineral resources declared by ALS Geo Resources LLC, effective 16 September 2025.
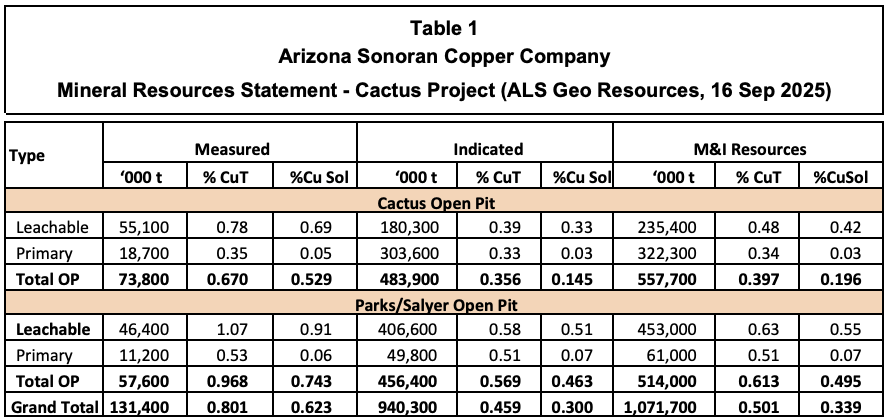
Not evident from the table is that there are additional Inferred resources at Cactus, which could potentially add another 24% CuSol there and at Parks/Salyer, which could add another 5%. This indicates that the resource table effectively captures available resources. Indicated Resources comprise by far the largest component of Measured and Indicated (“M&I”) resources: 77% of contained CuSol metal.
Mineral Reserves
The mineral reserve estimation is based on the assumption that mining will be conducted by conventional open-pit methods, with crushed material fed onto leach pads, and the pregnant solution subsequently treated in a solvent extraction–electrowinning (“SX/EW”) plant.
Given the large block size of the resource model, no dilution was applied. The cut-off grade was again expressed in soluble copper grade, varying between 0.091% and 0.093%.
Table 2 is the reserve statement in the technical report, effective 17 September 2025.
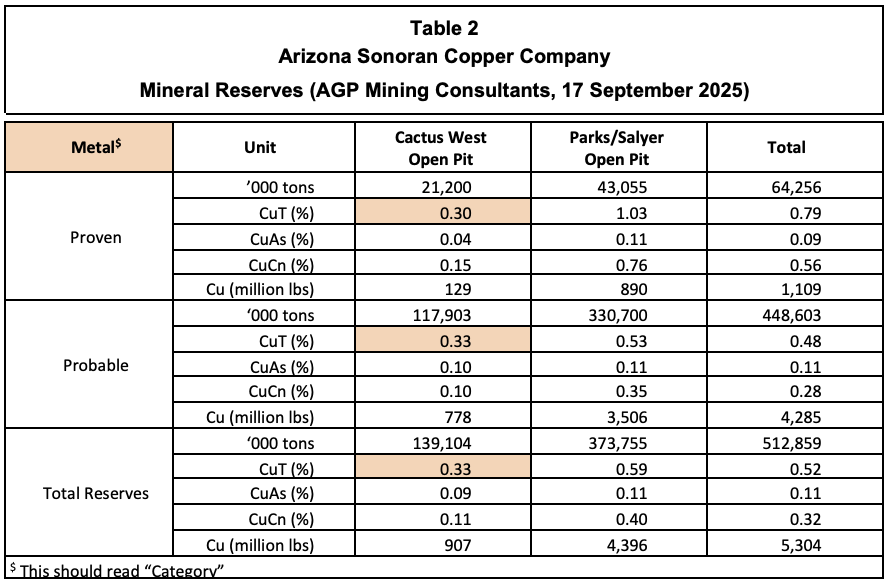
AGP Mining Consultants elected to present the reserve statement in a format entirely different from the mineral resource statement. Why is not clear, as the production schedule does not include many of the parameters of the reserve statement, and it makes comparison difficult. That this is not an academic issue is evident from the CuT grade for proven reserves at Cactus West, which are almost 55% lower than the resource grade. In Table 3, Crux Investor has attempted to recreate the reserve statement in the format of the resource statement, referring to the information in the production schedule.
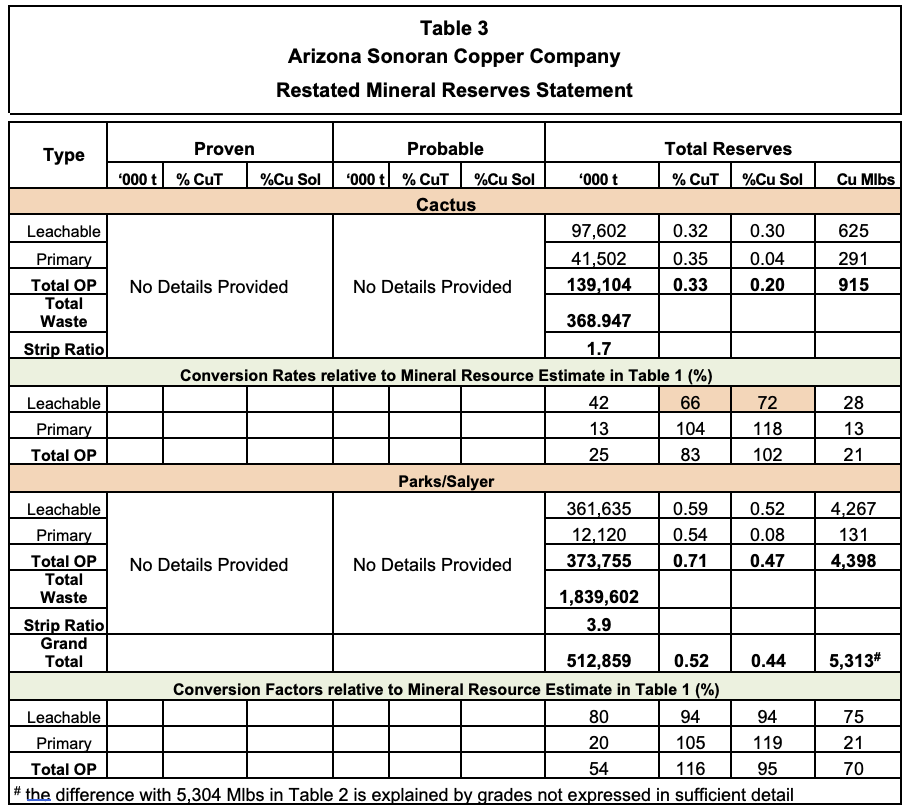
The highlighted low conversion rates for copper grade (66% for CuT and 72% for CuSol) for Cactus are due to the large drop in grade from Measured resources to Proven Resources. The large drop is nowhere explained and is probably an error by AGP Consultants. Consistency in format would have helped them to prevent such a mistake.
The table shows that the strip ratio of 3.9 at Parks/Salyer is much higher than the 1.7 applicable to Cactus. However, due to the much higher grade at Parks/Salyer, mining is planned to start here.
Mining Operations
The open-pit mining method proposed in the PFS is a conventional approach. The good condition of the old Cactus open-pit wall gives comfort about the geotechnical stability of the ground. However, at the new Cactus pit, and especially Parks/Salyer, overburden is present as alluvium and conglomerate. Additionally, at Parks/Salyer, the Basement Fault would impact pit stability if mining encroaches too far. For this reason, mining will cease 75 m away from this horizon.
Mining will initially target the Parks/Salyer deposit, which contains the highest-grade resources, over the first 16 years. The plan for mining the deposit has evolved from underground mining in the 2024 PFS to conventional drill-blast-haul open pit mining, greatly reducing risk compared to the 2024 PFS study. The block size of the resource model is considered an acceptable selective mining unit, and the mine plan considers that no factors, such as mining losses and dilution, need to be applied. Mining will initially focus on areas where the main high-grade Parks/Salyer ore body is closest to the surface. Figure 8 shows a cross-section looking west, with the pit design for Parks/Salyer, illustrating the pit phases and the type of mineralisation.

The cross-section shows that very little fresh mineralisation (in orange colour) will be mined in the early years, and what is mined during the first 10 years will be stockpiled for later treatment. The cross-section also illustrates how the pit depth has been constrained to not encroach within 75 m of the Basement Fault.
Figure 9 shows a cross-section through the Cactus West open-pit design, again with pit phases and the type of mineralisation. The first phase, during the production years 14-17, will extract predominantly non-fresh mineralisation and is carried out when mining at Parks/Salyer is nearing completion, supplying almost 50% of the leach feed. Phase 2 provides all the plant feed in the last three years of the LOM.
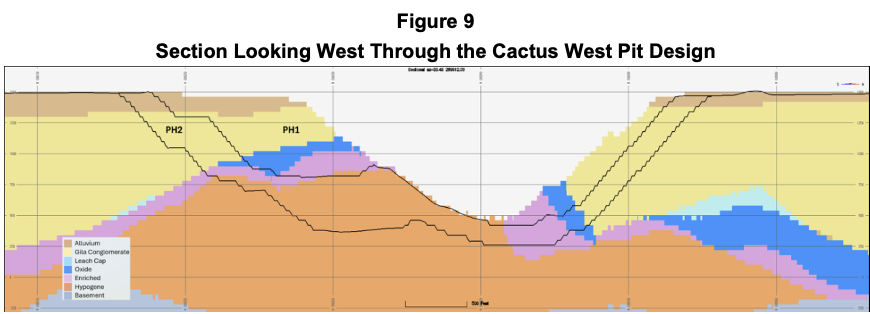
A multi-stage crush plant will be located to the north-west of the Parks/Salyer pit area. Stockpiling of ore is included in the mine schedule to help smooth the stripping and ore release profile and to accelerate the copper production profile. Hypogene leach materials mined in the first 10 years of the mine schedule will be stockpiled until processing of that material begins in year 10.
The main waste dump is around the Cactus West pit. Sequencing of waste dumping is organised to minimise haulage distances. However, the height of the waste dams is restricted in the flight path of planes to and from the local airport, with dumps in the north-east designed 30 m high and in the southwest 82 m high. According to the technical report, Cactus West waste is primarily dumped in the exhausted Parks/Salyer beginning in Year 14. Crux Investor records that, according to the mine schedule, mining at Parks/Salyer is expected to continue until Year 16. The feasibility of dumping during that period is not explained in the technical report.
Given the bulk nature of the deposits, large-scale mining equipment will be utilised, including 34 m³ diesel hydraulic shovels, 31 m³ loaders, and 290-tonne rigid-body haul trucks.
Metallurgical Test Work
Crux Investor's 2021 Analyst’s Notes were very critical of the standard of metallurgical testwork supporting the assumptions of the PEA study at the time. Much additional testwork has been carried out since, including material from Parks/Salyer and testing the amenability of enriched and fresh mineralisation to heap leaching. The current mine plan has significantly reduced the contribution of fresh mineralisation to the LOM feed; however, Table 13-3, with only 8.2 Mt of fresh feed, is in contradiction to Table 16-24, which includes 53.6 Mt of fresh material in its production schedule. This is another example of the inconsistencies in the technical report. Even so, with fresh ore constituting only 11% of the treated material, the metallurgical risk has reduced considerably.
The discussion on the 2025 testwork includes results for Stockpile material leaching, which is irrelevant to the business plan, and leaching of composites with leachable sulphides such as covellite and chalcocite, which are minerals in the enriched mineralisation. Conclusions from these tests were that these were amenable to acid heap leaching at a crush size P80 minus ¾ inch.
Recovery models were generated, and the LOM recoveries were determined for the various types of mineralisation, which are reproduced in Table 4, both without and with the application of a 95% scaling factor to account for inefficiencies in a practical heap leach situation. The table also gives gross acid consumption. Net acid consumption per ton of material is dependent on recoverable copper content, with a stoichiometric conversion of 1.54 tons of acid generated per ton of copper plated in electrowinning.
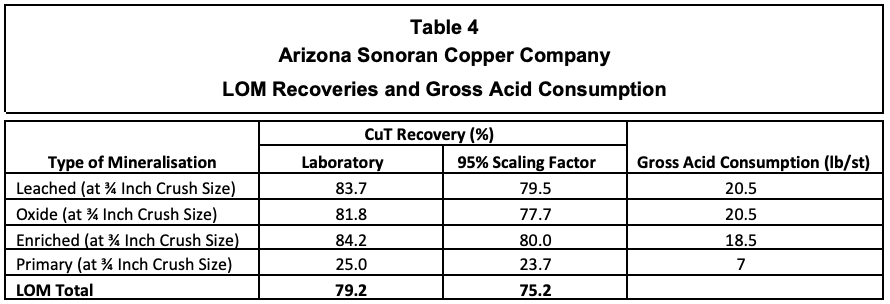
After all the discussions about test results that use soluble copper grades as inputs, there is a major logical jump in expressing recoveries as a function of total copper grade. Nowhere is the reason for this explained. With the resource model having block grades in CuSol grade, what is the point of the change?
Moreover, the recovery for primary mineralisation just drops out of the air. Crux Investor records that the 25% recovery is a carryover from the 2024 PEA study, a document that also does not provide information to support this number.
The LOM net acid consumption is calculated to be 7 lb/t per ton and varies from 0 to 15 lb/t.
Mineral Processing Options
The process route in this PFS is greatly simplified compared to when Crux Investor reviewed the Cactus project in 2023, when separate leach pads were envisaged for Oxide material and Enriched material. The process will now consist of a two-stage crushing and screening plant, with a P80 of minus ¾ inch, ahead of heap leaching. The crushing circuit product will be transferred to the lined heap leach pad and placed in 9-m lifts. Trucks and a dozer will be used to place material on the pad for the first lift. Agglomerators, conveyors and stacking equipment “may” (?) be added in Year 4. The maximum height of the heap will be 75 m (which is not a multiple of 9).
A leaching solution containing dilute sulfuric acid will be pumped and applied to the top of each lift via drip emitters, allowing it to percolate through the leach material. To reduce evaporation, drip lines will be buried at a depth of at least 0.6 m. Pregnant Leach solution (“PLS”) will drain by gravity and be collected in a PLS pond. Blowers introduce fresh air from the bottom of every second lift on the HLP to ensure sufficient oxygen is present for leaching.
The pregnant leach solution (“PLS”) will be processed in a solvent extraction (“SX”) and electrowinning (“EW”) plant. The SX-EW plant process design will include three extraction settlers, one strip settler, a tank house, and an initial electrowinning cathode capacity of 70,000 tonnes per year, followed by an expansion doubling in size to a capacity of 140,000 tonnes per annum between Year 3 and Year 4. Copper is plated onto stainless steel plates from the electrolyte solution during the EW operation. When the desired thickness of copper has been plated, the cathodes are harvested from the electrolytic cells, and the copper is mechanically stripped from the blank. The pure copper cathodes are the final product, which are bundled and shipped for sale.
Economic Evaluation
Metal Prices Used and Scenarios Analysed
This study has considered two price cases. One case uses the copper price of US$4.25/lb in the PFS, allowing a comparison between the taxes in the study cash flow model and the PFS model. The second case uses the spot prices on 2 December 2025 of US$5.05/lb as the Base Case for the study cash flow model.
Production Schedule
The PFS provides rudimentary information on annual production, including “productive ore tons” mined from the two pits (without specifying copper grades) and total tons mined from both pits. Process schedules are provided separately for Oxide/Enriched and Hypogene, this time with all the grade types. The numbers are provided in millions of tons without decimals. Crux Investor has adopted these schedules.
Figure 10 reproduces the only graph provided for mine production, not showing separately ore and waste mined, but Rehandle is shown.
True to the PFS report’s inconsistent nature, no such graph is provided for processing. Crux Investor has generated this based on the process volumes in Table 16-28 in the PFS report, shown at the bottom of Figure 10.
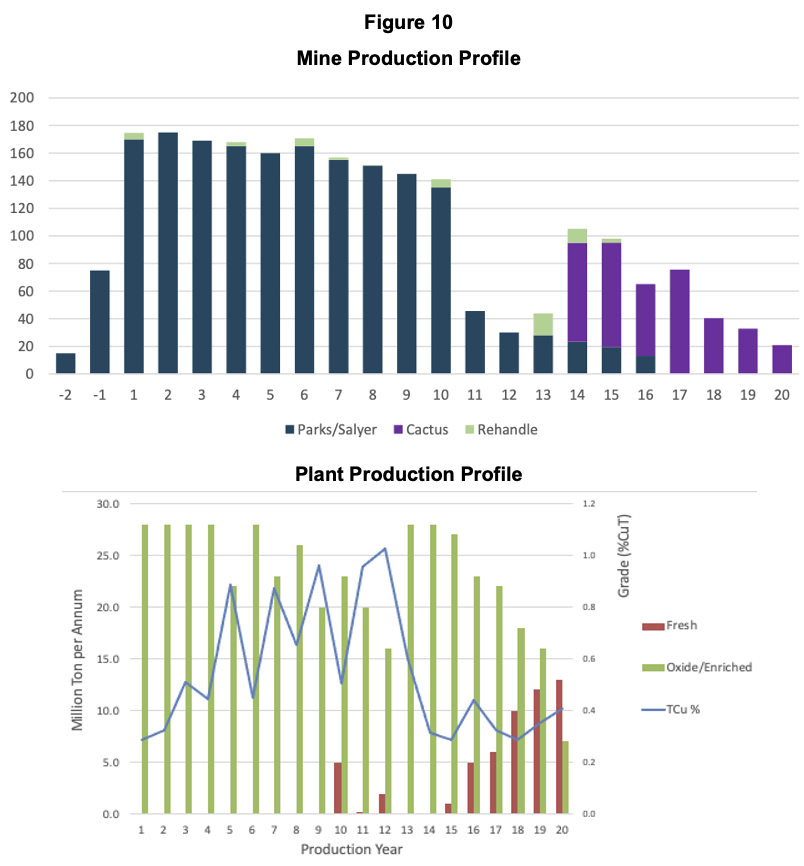
The diagram illustrates how the CuT grade decreases as the Parks/Salyer deposit approaches the end of its LOM.
Plant production is strangely fluctuating, with certain years having throughput well below 28 Mtpa. For example, in Year 15, the total feed is only 18 Mtpa. This important issue is not discussed in the report.
Capital Expenditure
Table 5 shows the capital cost estimates for initial construction and sustaining capital. The provisions for the SX/EW plant expansion in Year 3 and Year 4 are not provided but are included in the sustaining capital expenditure.
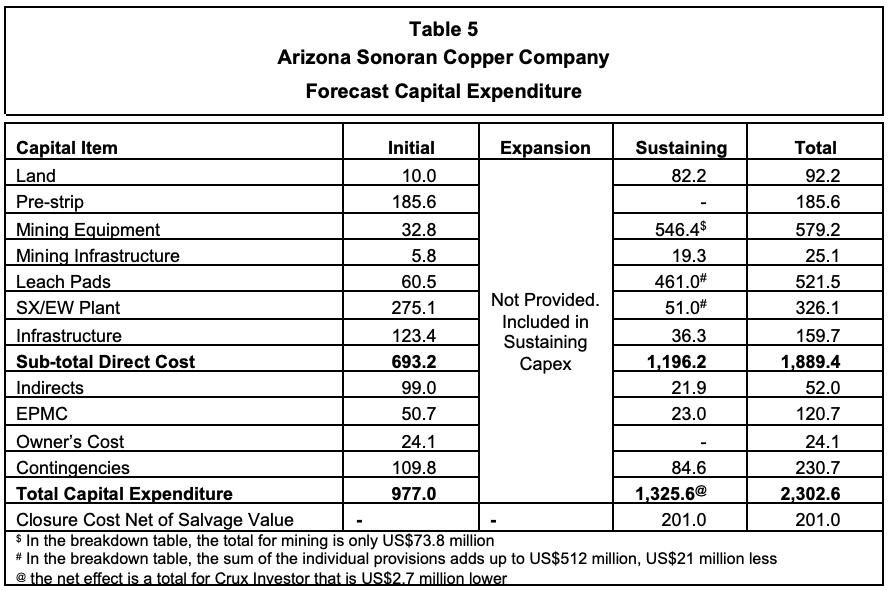
There are several inconsistencies between the summary table and the tables breaking down the provisions for the various categories. There is a significant difference between the overall sustaining capital expenditure provision for mining and the breakdown (resulting in US$73.8 million). From a very basic LOM cash flow table, it is apparent that the larger amount for mining applies and that the PFS has included an additional US$21 million for processing. Also clear from the annual amounts for capex in Year 1 – Year 4 is that US$1,062 million is spent during this period on expansion and sustaining items, with no breakdown provided.
The EPCM amounts convert to a rate of 10.9% for initial capital expenditure, excluding mining equipment and 4.0% for sustaining capital expenditure, excluding mining equipment. These provisions look low.
According to the PFS, contingencies were calculated at 5% of mining costs and 18% of plant and equipment costs.
Included in the capital expenditure is the purchase of land, which has already been fully accomplished and is accounted for in the company’s balance sheet. The Crux Investor case has accordingly removed the capital expenditure provisions and assumed that the additional 0.5% NSR royalty applies to all production.
Noticeable is the absence of an acid plant in the capital items. Given the large amounts of acid required over the LOM, such an omission is strange. Not having an acid plant implies purchasing acid instead of sulphur, which will push up the operating cost. This important consideration remains to be discussed by ASCC. Crux Investor has been advised by a process engineer with extensive experience with SX-EW operations to use a capital provision of US$400 million for an acid plant.
Operating Expenditure
Table 6 presents the estimated operating cost as per PFS. According to the PFS, the costs were estimated based on first principles. The problem with first principles estimation is that it, by definition, is always too low. You can only estimate items and activities that are considered, failing to include those overlooked. In addition, such estimations assume perfect execution. For these reasons, first-principles estimations should be checked against benchmarked numbers from similar operations.
Crux Investor has referred to two mines active in Arizona: Pinto Valley and Morenci. The information for Morenci has been extracted from a technical report dated January 2024; for Pinto Valley, reference was made to the actual numbers for the nine months in 2025. Not ideal, but again, reference was made to the Mount Milligan mine in British Columbia. The numbers have been converted to short tons where applicable.

From the table above, it is evident that the PFS assumes a cost structure that is consistently lower than that of its peers, even Morenci, which is also a heap leach SX/EW operation and uses electric shovels for loading. It is highly unlikely that Morenci leases its equipment.
Based on the above, Crux Investor concludes that the suggested cost structure for the Cactus project is significantly too low. Crux Investor has included in its model US$2.3/st for mining costs, US$5.4/st for processing and G&A of US$45 million per annum. Crux Investor has also added the burden of cash corporate expenditure, which, in the case of ASCC, is admirably low at US$4 million per annum. At this modest level, the company can certainly add a high-level technical person to ensure high-quality and consistent business plans.
Royalties and Taxes
The report is unclear about the proportion of feed that attracts which royalty. Table 16-17, which provides the pit shell parameters, uses a royalty of 2.0%-2.5% for Cactus and 2.54% for Parks/Salyer, without specifying the proportions to which these royalties apply. Table 21-7 reports total LOM royalties of US$324 million, whereas the schematic annual cash flow in Table 22-2 only includes US$304 million over the LOM. This converts to a rate of 1.8% of LOM revenue. Crux Investor has used this rate but added 0.5% for the landowners.
The technical report does not provide the exact tax regulations used to calculate an item that accounts for more than the total amount of capital expenditure. References are made to sections of the Act without providing details on how these sections apply to the project.
Crux Investor has utilised its understanding of applicable US regulations in an older valuation, disregarded the depletion allowance, and employed cost depletion to determine the tax base. Crux Investor arrives at total taxes that are 2.5% higher than in the PFS, after also including US$234 million of sunk exploration and development investments as per the financial statements.
Based on the above, Crux Investor concludes that overall, its tax model does not differ substantially.
Results
Table 7 summarises the LOM results for the PFS case, as Crux Investor understand this from the various disjointed tables in the technical report. It should be noted that the production models show final copper production in Year 20, whereas the very schematic cash flow model in Table 22-2 shows revenue extending two years further. This probably accounts for the delay in copper leaching from the leach pads. Whereas this is not unreasonable, it is another example of the convoluted and inconsistent nature of the PFS.
Also shown is the result of the business model Crux Investor believes is more realistic, which uses the spot copper price of US$4.99/lb.
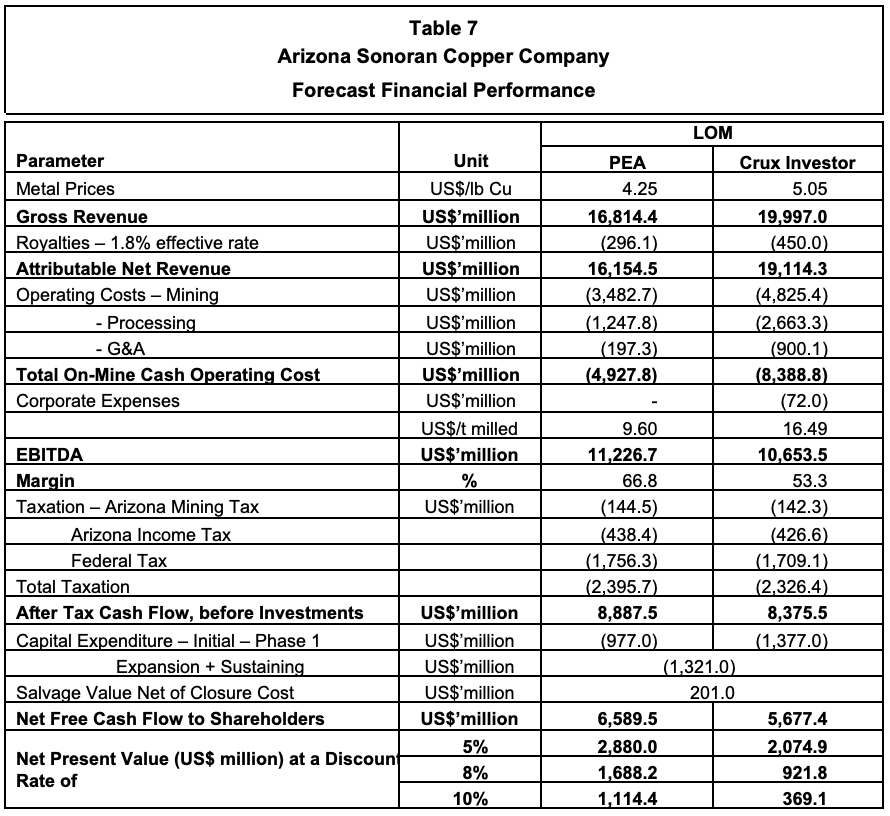
The table shows that using the PFS inputs, Crux Investor arrives at an NPV8 of US$1.69 billion, much lower than the US$2.30 billion suggested in the technical report. Although the NPV formula, which discounts negative cash flows, is applied to the annual cash flow numbers in Table 22-2 of the technical report, the calculated NPV is US$2.21 billion. However, this is only part of the story. Given the considerable outlay involved in the expansion, the payback period is actually quite long: more than five years for the PFS case and six years for the Crux Investor case, as evident in Figure 11, which displays the cumulative cash flow over the LOM.

The project becomes cash positive only from Year 3. Discounting negative cash flows is conceptually wrong. In feasibility studies, funding is typically fully equity financed. Such funding is secured upfront in practice and does not yield a real return of 8%. With negative cash flow not discounted, the NPV drops to N$1.69 billion as shown in Table 7.
When applying the higher royalty rate, the higher operating cost inputs suggested by Crux Investor, and removing the land acquisition cost, the NPV8 drops to US$0.92 billion, despite the higher copper price.
Table 8 presents the sensitivity of the project value to changes in NPVs per percentage point change in the main parameters: metal prices, operating expenditure, and capital expenditure.

The sensitivity analysis demonstrates that the NPV8 of the Cactus project increases by 7.2% (US$66 million) for every percentage point increase in the metal prices (i.e. US$0.05/lb) and drops by only 3.8% (US$35 million) for every percentage point increase in operating cost (i.e. US$0.165/t processed). Given the size of capital expenditure required, the NPV8 is relatively sensitive to changes in this parameter, changing 2.7% for every percentage point increase (i.e. US$25 million).
The Enterprise Value of Arizona Sonoran On 2 December 2025
At the share price of C$3.89 on 2 December 2025, the market capitalisation for the 205.5 million shares is C$799 million, or US$571 million.
Based on the financial statements for the quarter ended September 30, 2025, the company has no warrants outstanding; however, it currently has 7.8 million share options, all of which are in the money at an average price of C$1.36. Another 1.7 million restricted share units and deferred share units were outstanding.
As of 30 September 2025, the net current assets totalled US$35.1 million. On 2 December, there was a large private placement raising of C$86.2 million.
Nuton has paid deposits of US$21.5 million to exercise its option to take a major stake in the project, and the company has a deferred consideration of US$86.1 million related to the acquisition of the land.
Based on the above, an Enterprise Value on a diluted basis for ASCC of C$841 million (US$601 million) is derived as shown in Table 9.
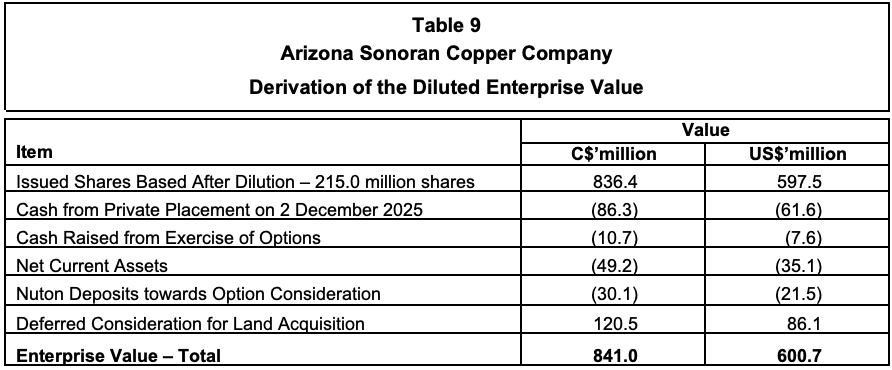
The Enterprise Value is 65% of the NPV8 value calculated by Crux Investor.
Considerations Relating To The Nuton Option Agreement
Drawing conclusions from Table 9 is complicated by the potential impact of the Nuton option, which was signed on 14 December 2023 between Nuton LLC, a subsidiary company of Rio Tinto, and ASCC. The option agreement relates to a potential joint venture between the two companies, should the Nuton processing technology be deployed at the Cactus project. Should this be the case, Nuton has the option to acquire between 35% and 40% of the project. For this option, Nuton must contribute up to US$33 million. However, this option is only exercisable should:
- The “Integrated Nuton PFS” indicate that the NPV of the project after applying the Nuton technology, including the MainSpring property, is at least 1.20 times larger than the NPV of the project without this technology. Note that no discount rate for the calculation of the NPV is given.
- ASCC equity contribution to the project capital cost is equal to or less than the equity contribution to the project without the Nuton technology, assuming 50% of the capital cost is financed by debt.
- Nuton makes the US$33 million payment.
The stake available to Nuton is dependent on the NPV increase of the Integrated Nuton Project, with 35% available to Nuton for a multiple between 1.20 and 1.29, 37.5% available for a multiple between 1.30 and 1.39, and 40% for a multiple in excess of 1.40.
In November 2024, it was agreed that the deadline for delivery of the draft Integrated Nuton PFS would be 31 December 2025, and its ultimate filing would be by 2 March 2026. This means that completion must occur during this month.
ASCC claims in its current PFS that the project has an NPV of US$2.30 billion at a copper price of US$4.25/lb. It is unclear to Crux Investor what agreements exist between the two companies regarding the recognition of the suggested current NPV8 of US$2.3 billion as a benchmark. Has Nuton endorsed this? Does Nuton accept the capital expenditure provisions and operating cost input?
Table 10 examines the impact of exercising the Nuton option on the remaining beneficial value of the ASCC stake in the Cactus project.

From the table above, it is evident that ASCC will see a reduction in the value of its beneficial stake in the project, ranging from 16% to 22%, should Nuton be able to exercise its option. This makes pitching X as high as possible beneficial for ASCC and detrimental for Nuton.
Executive Summary
Arizona Sonoran Copper Company (“ASCC”) (TSX:ASCU) is a Canadian company aiming to achieve mid-tier copper production status by developing the Cactus Project in Arizona, USA. This project is located at the former ASARCO’s Sacaton mine that processed 38 million tonnes (“Mt”) of primary ore from 1974 to 1984. The Cactus project now comprises the site of the old mine (now known as Cactus West) and the Parks/Salyer deposit, located 2 km southwest of Cactus West. The mineralisation is a copper porphyry affected by weathering, which has resulted in a leached cap, below which the copper minerals occur as oxide, and below which there is a zone where copper has been enriched and is present as acid-soluble sulphide minerals. Below the enriched zone, the mineralisation is present as fresh rock (also known as hypogene mineralisation), and the copper is present in its original form: chalcopyrite (CuFeS2).
Crux Investor reviewed ASCC in an Analyst’s Notes published in February 2023. The technical information at the time was presented in a Preliminary Economic Analysis (“PEA”) completed in 2021. The business plan was complex, involving the mining of a waste dump reclassified as “Stockpile”, an open-pit mine, and an underground mine. Processing envisaged two separate heap leach operations, one for oxide material, another for enriched material.
The Analyst’s Notes piece was not very complimentary about the 2021 PEA. For example, it was found that the amount of material to be mined exceeded stated resource estimates in key areas, metallurgical testwork was partial, incomplete, and poorly explained, and forecast metallurgical recoveries were overly optimistic. Despite these concerns, Crux Investor concluded that fundamentally, the overall Cactus project was encouraging. Using several more conservative assumptions in addition to the basic parameters provided by the PEA, Crux Investor arrived at an NPV8 of $445 million. At a copper price of $4.09/lb, the project was found to be robust with a cash operating margin of 55%.
Since 2023, there have been significant developments and numerous additional studies. Notably, the Parks/Salyer deposits were intensively explored, and later, the MainSpring area to the immediate south was also explored. This tremendously boosted the amounts of mineral resources. It attracted the attention of a subsidiary of Rio Tinto, Nuton LLC, which has a proprietary leaching technology which may add value to the project. An option agreement was concluded with Nuton, with its prospective stake varying from 35% to 40% depending on how much its technology would add value to the project.
ASCC has continued developing business plans in a 2024 prefeasibility study (“PFS”), followed by a 2024 PEA and finally a PFS that was published in November 2025. The studies show a progressive simplification of the business plan, with the latest study having dropped underground mining and using a single process route for all mineralisation types. In the opinion of Crux Investor, this has considerably reduced the risks associated with the Cactus project. The November PFS assumes standard acid heap leaching followed by solvent extraction (“SX”) and electrowinning (“EW”) of the copper to produce directly saleable copper cathodes. In December, Nuton will need to complete its PFS to demonstrate the extent to which its process can add value.
Crux Investor has attempted to independently reproduce the business case and model the future cash flow. It has found it very hard going. It is as if the technical report intentionally makes it difficult, if not impossible, for an outside party to come to grips with the project. There are numerous contradictions and inconsistencies in the information, as well as a general lack of detail. This also had an impact on the quality of the report. Crux Investor has picked up many mistakes. For example, with a change in format of the mineral reserve statement compared to the mineral resource statement, there is a substantial drop in total copper grade (“CuT”) of Measured Resources (0.67%) at Cactus West to Proven Reserves (0.30%).
One irritating inconsistency is the change in focus from soluble copper grade (“CuSol) in the discussion of mineral resource estimation (“MRE”) and metallurgical testwork to production schedule and life-of-mine (“LOM”) recoveries expressed in CuT.
The lack of information provided can also not be explained solely by a desire to keep the report brief. There is a lengthy discussion on the MRE of the stockpile, as well as an extensive discussion about metallurgical testwork. Considering that the Stockpile does not feature in the production schedule, it is totally irrelevant.
ASCC would benefit from appointing a technical person to oversee feasibility studies, ensuring that all parties are aligned and minimising inconsistencies and errors.
Crux Investor has made considerable effort to model the business case of ASCC, in particular to verify whether its tax model arrives at a broadly similar amount. After all, taxes are one of the main cash drains, exceeding LOM capital expenditure. The total taxes calculated by Crux Investor were found to be gratifyingly very close, being only 2.5% higher.
Crux Investor has also input the annual cash flow amounts extracted from a very rudimentary cash flow table in the technical report to verify the LOM royalty, the sequencing of expansion and sustaining capital expenditure and the calculation of the net present value (“NPV”).
For its own business case, Crux Investor has adopted all inputs, except where there are obvious mistakes, such as the inclusion of a provision for land acquisition that has already been secured, resulting in a 0.5% increase in royalties. After a benchmarking exercise, Crux Investor has substantially increased operating cost rates. Importantly, the PFS does not consider the construction of an acid plant. This would imply transport of enormous quantities of acid instead of sulphur. It would significantly add to operating costs. The issue is nowhere discussed. Crux Investor has included a provision of US$400 million for such a plant.
The Crux Investor case has used the spot copper price of US$5.05/lb, which is much more favourable than the US$4.25/lb in the PFS. The net effect is still a great drop in NPV8 from US$1.73 billion for PFS cash flow to US$0.92 billion. The NPV8 of US$2.30 billion quoted in the technical report is objectively incorrect, as it is based on an erroneous application of the NPV formula, which would typically yield a lower result. The conventional discounting of negative cash flow is, however, incorrect, as such a return is not earned on negative amounts. Given the long payback periods of five years for the PFS case and six years for the Crux Investor case, ignoring discounting of negative cash flows has a significant impact on the results.
The diluted Enterprise Value of 2 December 2025 is US$601 million, or 65% of the calculated NPV8.
However, with the possibility of Nuton exercising its option, no direct conclusions can be made about whether ASCC currently constitutes good value. Based on the qualifying criteria, exercising the Nuton option would reduce the value of the remaining stake for ASCC by between 16% and 22%. This implies that ASCC is better off with Nuton not being able to exercise. It is therefore in ASCC’s interest to pitch the NPV of its current NPV as high as possible. It raises the question: “Does Nuton need to endorse the validity of the 2025 NPV and the reasonableness of the business plan, as well as all its inputs?”
However, even when reducing the current NPV8 derived by Crux Investor by 22% as a worst-case scenario, this would bring the value for ASCC down to US$719 million, still above the current Enterprise Value.
ASCC remains good value.
Introduction & Study Progress Since The Previous Analyst's Notes
Arizona Sonoran Copper Company (“ASCC”) (TSX:ASCU) is a Canadian company aiming to achieve mid-tier copper production status by developing the Cactus and Parks/Salyer deposits in Arizona, USA. Cactus was formerly ASARCO’s Sacaton mine that processed 38 million tonnes (“Mt”) of primary ore from 1974 to 1984.
Following the acquisition of the old mine and its associated waste dumps in 2020, ASCC initiated technical studies and exploration. The waste dumps contain oxide material that had been reclassified as a Stockpile Resource. Other resource areas initially included the old Cactus West open-pit area and underground potential at Cactus East. A 2021 Preliminary Economic Analysis (“PEA”) outlined a 17-year staged operation. The PEA development sequence started with the Stockpile while preparing the old open-pit, then mining at the Cactus Mine West open pit, and finally opening the Cactus Mine East underground. The Analyst’s Notes piece, published in March 2023, was highly critical of the poor quality of the 2021 PEA study. For example, the amount of material to be mined – the Mineable Inventory – exceeded stated resource estimates in key areas. Metallurgical testwork was partial, incomplete, and poorly explained. Forecast metallurgical recoveries were aggressive. Acid consumption forecasts were inconsistent with test work. Operating cost estimates from the PEA were too low. Despite these shortcomings, Crux Investor found the overall project encouraging and the economics robust at a copper price of US$4.09/lb. The company traded at the time well below the NPV8 figure of US$445 million arrived at by Crux Investor.
Since the 2021 PEA, the company carried out substantial additional drilling of the Parks/Salyer deposit to the southwest of Cactus West and of the Cactus East deposit to the northeast of Cactus West. In addition, extensive metallurgical testwork was conducted, and the company evaluated the amenability of the mineralisation to treatment using Rio Tinto’s NutonTM technology.
In February 2023, ASCC agreed to acquire the MainSpring property, which is contiguous to the Parks/Salyer property, and began drilling there in October after the land was rezoned for industrial use.
In October 2023, the company could declare an updated mineral resource estimate (“MRE”) more than tripling the contained copper in the Measured and Indicated (“M&I) categories at a grade that was 9% higher. The results of Nuton™ testing were reportedly very encouraging, also judging from the fact that Rio Tinto and ASCC entered into a joint venture in December 2023, under which Nuton could acquire between 35% and 40% in the project, depending on the degree to which the estimated NPV using the technology would exceed the NPV without this process.
In February 2024, the results of the PFS were released, indicating an NPV8 of US$0.51 billion. Crux Investor records that the reserves for mining the underground section of Cactus again far exceeded those of M&I Resources (i.e., 27.7 Mt at a 0.95% TCu grade versus 10.4 Mt at a 0.88% TCu grade). It seems that Ausenco did not learn from its previous poor reporting.
The March 2024 PFS was rapidly superseded by another PEA report dated August 2024, this time published under the auspices of M3 Engineering but using the same consultants for mineral resources and mineral reserves. It is therefore not surprising that the production schedule included almost 2.5x the mineral resources tonnage at Cactus underground in the plant feed. It appears that the peer review of the technical reports related to the Cactus project were either cursory or non-existent.
The main difference between the two studies was the change in scope from underground mining in the PFS to open-pit mining in the PEA for Parks/Salyer. Moreover, being a PEA allowed the inclusion of Inferred resources in the mine plan, which increased the amount processed by 222%, dropped the TCu grade by 24%, resulting in 145% more TCu contained in the feed. Apart from benefiting from the Inferred Resources, the PEA also used much higher conversion rates than the PFS. Whereas the PFS converted 34% of the tonnage of the Cactus Open Pit Indicated resources to reserves and 61% of Parks/Salyer, the PEA converted 81% of the total resources’ tonnage from Cactus Open Pit to plant feed and 85% from Parks/Salyer open pit. No wonder the NPV8 improved from US$509 million in the PFS to US$2,032 million in the PEA.
In October 2024, ASCC initiated another PFS study, this time with M3 Engineering as the lead consultant.
In January 2025, Hudbay Minerals Incorporated (“Hudbay”) took a strategic stake in the company by investing C$20 million. A subsidiary of Royal Gold acquired an existing royalty of 2.5% from Tembo Capital in February 2025 for US$55 million.
In November, the PFS was published. It differs from the PEA by ignoring the treatment of the Stockpile, assuming open-pit mining solely, and dramatically reducing the life-of-mine (“LOM”) plant feed to 513 Mt, compared to 889 Mt in the PEA. The peak production plant throughput was decreased from 31 Mt per annum (“Mtpa”) to 28 Mtpa. The net effect was the reduction of the LOM from 31 years to 20 years. This Analyst’s Notes will review the business plan in this report.
Location And Mineral Tenements
The project area is located 40 road miles south-southeast of the Greater Phoenix metropolitan area and approximately 6 miles northwest of the city of Casa Grande, Pinal County, Arizona (see Figure 1). The area is well serviced by infrastructure.
Immediately to the southwest, Cactus abuts the start of Ivanhoe Electric Inc.’s (“Ivanhoe Electric”) Santa Cruz claims. Ivanhoe Electric is a US$2.1 billion exploration and development company with a number of assets, including the flagship Santa Cruz copper deposit.
The total tenement area is currently approximately 7,843 acres. The project is subject to four royalties based on potential mining production, some of which are subject to an option to a partial repurchase. The discussion of these royalties is too unclear to model their effect. Crux Investor records that the LOM royalty payments, as per the PFS, amount to 1.8% of revenue, increasing from nil in Production Year 1 to a peak of 2.60% in Production Year 12. This rate seems to exclude an additional 0.5% rate granted to the owners of 2,203 acres of land recently purchased on production from this land. The agreement was concluded on 29 August 2025, well before the completion of the PFS.
Geology And Mineralisation
The Cactus project's hard rock deposits are copper porphyries which have been displaced in a north-easterly direction along a shallow-dipping Basement Fault. The Basement Fault has, in turn, been affected by cross-cutting faults, resulting in the deposits present in “horst” blocks. Horsts are raised fault blocks.
Figure 2, below, shows a plan view with the location of deposits along the northeast/southwest-trending mineralised corridor. The cross-section A-A’ is a good illustration of the deeper Santa Cruz deposit to the southwest, followed by Parks/Salyer in the middle, and the Cactus West open pit profile visible on the right of the section. Cactus East mineralisation is the deeper portion on the very edge of the cross-section.
The geology in the area has a history of oxidation and leaching through weathering. Both the Cactus and Parks/Salyer deposits are characterised by a zonation that varies with depth. At the top, there is a Leached zone devoid of copper, followed by an Oxide zone and a subsequent Enriched zone. The weathered zones have overly fresh mineralisation. See Figure 3, below, for a cross-section through the deposits to illustrate this zonation.
In the Oxide zone, copper is predominantly present as chrysocolla, brochantite and malachite. Chrysocolla is a hydrated copper silicate, brochantite is a copper sulphate, and malachite is a copper carbonate. All three minerals are acid-soluble and can be leached to produce a high-purity copper cathode with conventional hydrometallurgical processing such as solvent-extraction / electro-winning (“SX/EW”).
In the Enriched zone, copper is largely present as chalcocite and in the primary zone as chalcopyrite. Both are sulphides. Chalcocite is especially copper-rich, and it is cyanide soluble and can be partially leached by sulphuric acid to produce a high-purity copper cathode in an SX/EW plant.
Chalcopyrite readily upgrades to copper-sulphide concentrates, but cannot be leached by sulphuric acid under atmospheric conditions.
Mineral Resources
Mineral resources were estimated for Cactus, open-pit resources for Cactus West and underground resources for Cactus East, Parks/Salyer and the Stockpile. For the Cactus project, a database of 743 holes is available, including 560 holes drilled since 2019. The resource estimate for the Cactus deposits is supported by 363 holes. The Parks/Salyer database contains 296 holes. It makes for an impressive drill density, as is shown in Figure 4.
The estimation domains are based on their weathering status: Leached, Oxide. Enriched and Fresh, see Figure 3. These distinctions are based on logging of the type of copper mineral and sequential copper assaying: acid-soluble analysis (“CuAs”) followed by cyanide-soluble (“CuCN”) analysis, which together determine total soluble copper (“Tsol”) grade. Total copper (“CuT”) assay was also carried out.
As shown in Figure 2 and Figure 3, the mineralised units are enclosed between basement units and overlying conglomerate/alluvium. Figure 5 shows the Oxide (red outline), Enriched (purple outline) and Fresh (blue outline) rock domains on a section through the various deposits.
Assaying was typically conducted on 3 m lengths; therefore, a composite length of 6 m was chosen, which aligns well with the envisaged 12 m pit block size. Contacts between the various copper mineral domains were treated as hard, meaning that grades in one particular domain would not inform on the grade of blocks in another domain.
Based on histogram and log normal cumulative probability plots for CuT, ASCu, CuCN, and Tsol in each of the mineral zones, grade capping levels were determined.
Although variogram analysis was conducted for each domain, the technical report does not provide illustrations of how well-defined these are. The nugget effects are generally low, between 5% and 18%, and the search radii are large, typically exceeding hundreds of metres. The parent block size for grade estimation was chosen at 36.6 m x 36.6 m x 36.6 m with sub-blocking of 6 m x 6 m x 6 m to honour geological and topographic contacts. Block grades were estimated by ordinary kriging. The estimations for Cactus West and Cactus East were carried out separately.
The illustrations comparing block grades with drill intersection grades show an impressively good correlation, as evident in Figure 6 for Cactus and Figure 7 for Parks/Salyer.
The technical report also includes a long discussion (more exhaustive than for hard rock mineral resource estimation) on the resource estimation for the Stockpile, which is far less convincing than the estimation of the in-situ resources. The discussion has been deemed irrelevant by Crux Investor, as the Stockpile is not part of the business plan.
To comply with the reasonable prospect of eventual economic extraction (“RPEEE”) criterion, cut-off grades were determined “based on a high-level cost analysis”, a copper price of US$4.20/lb, and metallurgical recoveries discussed in Metallurgical Test Work later in this report. The cut-off grades expressed in Tsol grade vary from 0.079% to 0.087% for the various types of mineralisation and deposits.
Table 1 gives the mineral resources declared by ALS Geo Resources LLC, effective 16 September 2025.
Not evident from the table is that there are additional Inferred resources at Cactus, which could potentially add another 24% CuSol there and at Parks/Salyer, which could add another 5%. This indicates that the resource table effectively captures available resources. Indicated Resources comprise by far the largest component of Measured and Indicated (“M&I”) resources: 77% of contained CuSol metal.
Mineral Reserves
The mineral reserve estimation is based on the assumption that mining will be conducted by conventional open-pit methods, with crushed material fed onto leach pads, and the pregnant solution subsequently treated in a solvent extraction–electrowinning (“SX/EW”) plant.
Given the large block size of the resource model, no dilution was applied. The cut-off grade was again expressed in soluble copper grade, varying between 0.091% and 0.093%.
Table 2 is the reserve statement in the technical report, effective 17 September 2025.
AGP Mining Consultants elected to present the reserve statement in a format entirely different from the mineral resource statement. Why is not clear, as the production schedule does not include many of the parameters of the reserve statement, and it makes comparison difficult. That this is not an academic issue is evident from the CuT grade for proven reserves at Cactus West, which are almost 55% lower than the resource grade. In Table 3, Crux Investor has attempted to recreate the reserve statement in the format of the resource statement, referring to the information in the production schedule.
The highlighted low conversion rates for copper grade (66% for CuT and 72% for CuSol) for Cactus are due to the large drop in grade from Measured resources to Proven Resources. The large drop is nowhere explained and is probably an error by AGP Consultants. Consistency in format would have helped them to prevent such a mistake.
The table shows that the strip ratio of 3.9 at Parks/Salyer is much higher than the 1.7 applicable to Cactus. However, due to the much higher grade at Parks/Salyer, mining is planned to start here.
Mining Operations
The open-pit mining method proposed in the PFS is a conventional approach. The good condition of the old Cactus open-pit wall gives comfort about the geotechnical stability of the ground. However, at the new Cactus pit, and especially Parks/Salyer, overburden is present as alluvium and conglomerate. Additionally, at Parks/Salyer, the Basement Fault would impact pit stability if mining encroaches too far. For this reason, mining will cease 75 m away from this horizon.
Mining will initially target the Parks/Salyer deposit, which contains the highest-grade resources, over the first 16 years. The plan for mining the deposit has evolved from underground mining in the 2024 PFS to conventional drill-blast-haul open pit mining, greatly reducing risk compared to the 2024 PFS study. The block size of the resource model is considered an acceptable selective mining unit, and the mine plan considers that no factors, such as mining losses and dilution, need to be applied. Mining will initially focus on areas where the main high-grade Parks/Salyer ore body is closest to the surface. Figure 8 shows a cross-section looking west, with the pit design for Parks/Salyer, illustrating the pit phases and the type of mineralisation.
The cross-section shows that very little fresh mineralisation (in orange colour) will be mined in the early years, and what is mined during the first 10 years will be stockpiled for later treatment. The cross-section also illustrates how the pit depth has been constrained to not encroach within 75 m of the Basement Fault.
Figure 9 shows a cross-section through the Cactus West open-pit design, again with pit phases and the type of mineralisation. The first phase, during the production years 14-17, will extract predominantly non-fresh mineralisation and is carried out when mining at Parks/Salyer is nearing completion, supplying almost 50% of the leach feed. Phase 2 provides all the plant feed in the last three years of the LOM.
A multi-stage crush plant will be located to the north-west of the Parks/Salyer pit area. Stockpiling of ore is included in the mine schedule to help smooth the stripping and ore release profile and to accelerate the copper production profile. Hypogene leach materials mined in the first 10 years of the mine schedule will be stockpiled until processing of that material begins in year 10.
The main waste dump is around the Cactus West pit. Sequencing of waste dumping is organised to minimise haulage distances. However, the height of the waste dams is restricted in the flight path of planes to and from the local airport, with dumps in the north-east designed 30 m high and in the southwest 82 m high. According to the technical report, Cactus West waste is primarily dumped in the exhausted Parks/Salyer beginning in Year 14. Crux Investor records that, according to the mine schedule, mining at Parks/Salyer is expected to continue until Year 16. The feasibility of dumping during that period is not explained in the technical report.
Given the bulk nature of the deposits, large-scale mining equipment will be utilised, including 34 m³ diesel hydraulic shovels, 31 m³ loaders, and 290-tonne rigid-body haul trucks.
Metallurgical Test Work
Crux Investor's 2021 Analyst’s Notes were very critical of the standard of metallurgical testwork supporting the assumptions of the PEA study at the time. Much additional testwork has been carried out since, including material from Parks/Salyer and testing the amenability of enriched and fresh mineralisation to heap leaching. The current mine plan has significantly reduced the contribution of fresh mineralisation to the LOM feed; however, Table 13-3, with only 8.2 Mt of fresh feed, is in contradiction to Table 16-24, which includes 53.6 Mt of fresh material in its production schedule. This is another example of the inconsistencies in the technical report. Even so, with fresh ore constituting only 11% of the treated material, the metallurgical risk has reduced considerably.
The discussion on the 2025 testwork includes results for Stockpile material leaching, which is irrelevant to the business plan, and leaching of composites with leachable sulphides such as covellite and chalcocite, which are minerals in the enriched mineralisation. Conclusions from these tests were that these were amenable to acid heap leaching at a crush size P80 minus ¾ inch.
Recovery models were generated, and the LOM recoveries were determined for the various types of mineralisation, which are reproduced in Table 4, both without and with the application of a 95% scaling factor to account for inefficiencies in a practical heap leach situation. The table also gives gross acid consumption. Net acid consumption per ton of material is dependent on recoverable copper content, with a stoichiometric conversion of 1.54 tons of acid generated per ton of copper plated in electrowinning.
After all the discussions about test results that use soluble copper grades as inputs, there is a major logical jump in expressing recoveries as a function of total copper grade. Nowhere is the reason for this explained. With the resource model having block grades in CuSol grade, what is the point of the change?
Moreover, the recovery for primary mineralisation just drops out of the air. Crux Investor records that the 25% recovery is a carryover from the 2024 PEA study, a document that also does not provide information to support this number.
The LOM net acid consumption is calculated to be 7 lb/t per ton and varies from 0 to 15 lb/t.
Mineral Processing Options
The process route in this PFS is greatly simplified compared to when Crux Investor reviewed the Cactus project in 2023, when separate leach pads were envisaged for Oxide material and Enriched material. The process will now consist of a two-stage crushing and screening plant, with a P80 of minus ¾ inch, ahead of heap leaching. The crushing circuit product will be transferred to the lined heap leach pad and placed in 9-m lifts. Trucks and a dozer will be used to place material on the pad for the first lift. Agglomerators, conveyors and stacking equipment “may” (?) be added in Year 4. The maximum height of the heap will be 75 m (which is not a multiple of 9).
A leaching solution containing dilute sulfuric acid will be pumped and applied to the top of each lift via drip emitters, allowing it to percolate through the leach material. To reduce evaporation, drip lines will be buried at a depth of at least 0.6 m. Pregnant Leach solution (“PLS”) will drain by gravity and be collected in a PLS pond. Blowers introduce fresh air from the bottom of every second lift on the HLP to ensure sufficient oxygen is present for leaching.
The pregnant leach solution (“PLS”) will be processed in a solvent extraction (“SX”) and electrowinning (“EW”) plant. The SX-EW plant process design will include three extraction settlers, one strip settler, a tank house, and an initial electrowinning cathode capacity of 70,000 tonnes per year, followed by an expansion doubling in size to a capacity of 140,000 tonnes per annum between Year 3 and Year 4. Copper is plated onto stainless steel plates from the electrolyte solution during the EW operation. When the desired thickness of copper has been plated, the cathodes are harvested from the electrolytic cells, and the copper is mechanically stripped from the blank. The pure copper cathodes are the final product, which are bundled and shipped for sale.
Economic Evaluation
Metal Prices Used and Scenarios Analysed
This study has considered two price cases. One case uses the copper price of US$4.25/lb in the PFS, allowing a comparison between the taxes in the study cash flow model and the PFS model. The second case uses the spot prices on 2 December 2025 of US$5.05/lb as the Base Case for the study cash flow model.
Production Schedule
The PFS provides rudimentary information on annual production, including “productive ore tons” mined from the two pits (without specifying copper grades) and total tons mined from both pits. Process schedules are provided separately for Oxide/Enriched and Hypogene, this time with all the grade types. The numbers are provided in millions of tons without decimals. Crux Investor has adopted these schedules.
Figure 10 reproduces the only graph provided for mine production, not showing separately ore and waste mined, but Rehandle is shown.
True to the PFS report’s inconsistent nature, no such graph is provided for processing. Crux Investor has generated this based on the process volumes in Table 16-28 in the PFS report, shown at the bottom of Figure 10.
The diagram illustrates how the CuT grade decreases as the Parks/Salyer deposit approaches the end of its LOM.
Plant production is strangely fluctuating, with certain years having throughput well below 28 Mtpa. For example, in Year 15, the total feed is only 18 Mtpa. This important issue is not discussed in the report.
Capital Expenditure
Table 5 shows the capital cost estimates for initial construction and sustaining capital. The provisions for the SX/EW plant expansion in Year 3 and Year 4 are not provided but are included in the sustaining capital expenditure.
There are several inconsistencies between the summary table and the tables breaking down the provisions for the various categories. There is a significant difference between the overall sustaining capital expenditure provision for mining and the breakdown (resulting in US$73.8 million). From a very basic LOM cash flow table, it is apparent that the larger amount for mining applies and that the PFS has included an additional US$21 million for processing. Also clear from the annual amounts for capex in Year 1 – Year 4 is that US$1,062 million is spent during this period on expansion and sustaining items, with no breakdown provided.
The EPCM amounts convert to a rate of 10.9% for initial capital expenditure, excluding mining equipment and 4.0% for sustaining capital expenditure, excluding mining equipment. These provisions look low.
According to the PFS, contingencies were calculated at 5% of mining costs and 18% of plant and equipment costs.
Included in the capital expenditure is the purchase of land, which has already been fully accomplished and is accounted for in the company’s balance sheet. The Crux Investor case has accordingly removed the capital expenditure provisions and assumed that the additional 0.5% NSR royalty applies to all production.
Noticeable is the absence of an acid plant in the capital items. Given the large amounts of acid required over the LOM, such an omission is strange. Not having an acid plant implies purchasing acid instead of sulphur, which will push up the operating cost. This important consideration remains to be discussed by ASCC. Crux Investor has been advised by a process engineer with extensive experience with SX-EW operations to use a capital provision of US$400 million for an acid plant.
Operating Expenditure
Table 6 presents the estimated operating cost as per PFS. According to the PFS, the costs were estimated based on first principles. The problem with first principles estimation is that it, by definition, is always too low. You can only estimate items and activities that are considered, failing to include those overlooked. In addition, such estimations assume perfect execution. For these reasons, first-principles estimations should be checked against benchmarked numbers from similar operations.
Crux Investor has referred to two mines active in Arizona: Pinto Valley and Morenci. The information for Morenci has been extracted from a technical report dated January 2024; for Pinto Valley, reference was made to the actual numbers for the nine months in 2025. Not ideal, but again, reference was made to the Mount Milligan mine in British Columbia. The numbers have been converted to short tons where applicable.
From the table above, it is evident that the PFS assumes a cost structure that is consistently lower than that of its peers, even Morenci, which is also a heap leach SX/EW operation and uses electric shovels for loading. It is highly unlikely that Morenci leases its equipment.
Based on the above, Crux Investor concludes that the suggested cost structure for the Cactus project is significantly too low. Crux Investor has included in its model US$2.3/st for mining costs, US$5.4/st for processing and G&A of US$45 million per annum. Crux Investor has also added the burden of cash corporate expenditure, which, in the case of ASCC, is admirably low at US$4 million per annum. At this modest level, the company can certainly add a high-level technical person to ensure high-quality and consistent business plans.
Royalties and Taxes
The report is unclear about the proportion of feed that attracts which royalty. Table 16-17, which provides the pit shell parameters, uses a royalty of 2.0%-2.5% for Cactus and 2.54% for Parks/Salyer, without specifying the proportions to which these royalties apply. Table 21-7 reports total LOM royalties of US$324 million, whereas the schematic annual cash flow in Table 22-2 only includes US$304 million over the LOM. This converts to a rate of 1.8% of LOM revenue. Crux Investor has used this rate but added 0.5% for the landowners.
The technical report does not provide the exact tax regulations used to calculate an item that accounts for more than the total amount of capital expenditure. References are made to sections of the Act without providing details on how these sections apply to the project.
Crux Investor has utilised its understanding of applicable US regulations in an older valuation, disregarded the depletion allowance, and employed cost depletion to determine the tax base. Crux Investor arrives at total taxes that are 2.5% higher than in the PFS, after also including US$234 million of sunk exploration and development investments as per the financial statements.
Based on the above, Crux Investor concludes that overall, its tax model does not differ substantially.
Results
Table 7 summarises the LOM results for the PFS case, as Crux Investor understand this from the various disjointed tables in the technical report. It should be noted that the production models show final copper production in Year 20, whereas the very schematic cash flow model in Table 22-2 shows revenue extending two years further. This probably accounts for the delay in copper leaching from the leach pads. Whereas this is not unreasonable, it is another example of the convoluted and inconsistent nature of the PFS.
Also shown is the result of the business model Crux Investor believes is more realistic, which uses the spot copper price of US$4.99/lb.
The table shows that using the PFS inputs, Crux Investor arrives at an NPV8 of US$1.69 billion, much lower than the US$2.30 billion suggested in the technical report. Although the NPV formula, which discounts negative cash flows, is applied to the annual cash flow numbers in Table 22-2 of the technical report, the calculated NPV is US$2.21 billion. However, this is only part of the story. Given the considerable outlay involved in the expansion, the payback period is actually quite long: more than five years for the PFS case and six years for the Crux Investor case, as evident in Figure 11, which displays the cumulative cash flow over the LOM.
The project becomes cash positive only from Year 3. Discounting negative cash flows is conceptually wrong. In feasibility studies, funding is typically fully equity financed. Such funding is secured upfront in practice and does not yield a real return of 8%. With negative cash flow not discounted, the NPV drops to N$1.69 billion as shown in Table 7.
When applying the higher royalty rate, the higher operating cost inputs suggested by Crux Investor, and removing the land acquisition cost, the NPV8 drops to US$0.92 billion, despite the higher copper price.
Table 8 presents the sensitivity of the project value to changes in NPVs per percentage point change in the main parameters: metal prices, operating expenditure, and capital expenditure.
The sensitivity analysis demonstrates that the NPV8 of the Cactus project increases by 7.2% (US$66 million) for every percentage point increase in the metal prices (i.e. US$0.05/lb) and drops by only 3.8% (US$35 million) for every percentage point increase in operating cost (i.e. US$0.165/t processed). Given the size of capital expenditure required, the NPV8 is relatively sensitive to changes in this parameter, changing 2.7% for every percentage point increase (i.e. US$25 million).
The Enterprise Value of Arizona Sonoran On 2 December 2025
At the share price of C$3.89 on 2 December 2025, the market capitalisation for the 205.5 million shares is C$799 million, or US$571 million.
Based on the financial statements for the quarter ended September 30, 2025, the company has no warrants outstanding; however, it currently has 7.8 million share options, all of which are in the money at an average price of C$1.36. Another 1.7 million restricted share units and deferred share units were outstanding.
As of 30 September 2025, the net current assets totalled US$35.1 million. On 2 December, there was a large private placement raising of C$86.2 million.
Nuton has paid deposits of US$21.5 million to exercise its option to take a major stake in the project, and the company has a deferred consideration of US$86.1 million related to the acquisition of the land.
Based on the above, an Enterprise Value on a diluted basis for ASCC of C$841 million (US$601 million) is derived as shown in Table 9.
The Enterprise Value is 65% of the NPV8 value calculated by Crux Investor.
Considerations Relating To The Nuton Option Agreement
Drawing conclusions from Table 9 is complicated by the potential impact of the Nuton option, which was signed on 14 December 2023 between Nuton LLC, a subsidiary company of Rio Tinto, and ASCC. The option agreement relates to a potential joint venture between the two companies, should the Nuton processing technology be deployed at the Cactus project. Should this be the case, Nuton has the option to acquire between 35% and 40% of the project. For this option, Nuton must contribute up to US$33 million. However, this option is only exercisable should:
- The “Integrated Nuton PFS” indicate that the NPV of the project after applying the Nuton technology, including the MainSpring property, is at least 1.20 times larger than the NPV of the project without this technology. Note that no discount rate for the calculation of the NPV is given.
- ASCC equity contribution to the project capital cost is equal to or less than the equity contribution to the project without the Nuton technology, assuming 50% of the capital cost is financed by debt.
- Nuton makes the US$33 million payment.
The stake available to Nuton is dependent on the NPV increase of the Integrated Nuton Project, with 35% available to Nuton for a multiple between 1.20 and 1.29, 37.5% available for a multiple between 1.30 and 1.39, and 40% for a multiple in excess of 1.40.
In November 2024, it was agreed that the deadline for delivery of the draft Integrated Nuton PFS would be 31 December 2025, and its ultimate filing would be by 2 March 2026. This means that completion must occur during this month.
ASCC claims in its current PFS that the project has an NPV of US$2.30 billion at a copper price of US$4.25/lb. It is unclear to Crux Investor what agreements exist between the two companies regarding the recognition of the suggested current NPV8 of US$2.3 billion as a benchmark. Has Nuton endorsed this? Does Nuton accept the capital expenditure provisions and operating cost input?
Table 10 examines the impact of exercising the Nuton option on the remaining beneficial value of the ASCC stake in the Cactus project.
From the table above, it is evident that ASCC will see a reduction in the value of its beneficial stake in the project, ranging from 16% to 22%, should Nuton be able to exercise its option. This makes pitching X as high as possible beneficial for ASCC and detrimental for Nuton.
To read the FULL report, for FREE, please subscribe below.
- Notification By Email When Our Latest Notes Are Published With Immediate Access As Soon As They Go "Live"
- Suggest Future Companies To Be Analysed (Launching Soon)
- Additional Related Notes and "How To's" To Aid You On Your Investment Journey.
Already a subscriber? Sign in