Executive Summary
Discovery Metals Corporation (“Discovery Metals”) (OTCQX:DSVMF) (TSX:DSV), is a Canadian mineral exploration and development company headquartered in Toronto, Canada, and focused on historic mining districts in Mexico. Discovery’s flagship is its 100%-owned Cordero silver project in Chihuahua State, Mexico. The 35,000-hectare property covers the announced resource and other exploration targets. The Company has a market capitalisation of C$614 million, it has recently completed a top-up capital raise and currently has over C$80 million in cash on the balance sheet. Discovery Metals is part of the Oxygen Group of companies and Eric Sprott is its largest shareholder.
Discovery Metals has a varied history, dating back to incorporation in 1986 but of most relevance was a Qualifying Transaction for listing on the TSX in April 2017. At this time the Company acquired some polymetallic Pb-Zn-Ag mineral properties in the Coahuille State of Mexico, and other holdings were later added to the portfolio by similar acquisitions. This starter portfolio contained a collection of licences grouped into three properties named Puerto Rico, Minerva and Monclova. Standard exploration (surface and underground mapping, sampling) was carried out during 2018 and into 2019, with a subsequent plan to drill Monclova after ‘promising’ results at Minerva and Monclova. In the end, this drill programme did not happen. At Puerto Rico the company reported in 2019 that it was in the final stages of a “land re-designation process” to enable drill permit applications. In the end, management focus shifted, and no major announcements have been made by Discovery Metals about the Puerto Rico re-designation status. The reason is that management focus shifted to the Cordero project.
Discovery Metals acquired Cordero through a plan of arrangement takeover of Levon Resources Limited (“Levon”) in April 2019. Cordero was the subject of a 2018 preliminary economic assessment (“PEA”) commissioned by Levon, which is now available on the Discovery Metals website and it is the main source material for this report. Since acquiring Cordero in August 2019, the Company focus has been on understanding the nature of the higher-grade zones within the larger mineralized system with the objective of upgrading the economic potential of the Project.
Looking at the Cordero numbers both Crux Investor and Discovery Metals know that the resource as it stands is too low grade to drive capital. This is why Discovery is working at improving the economics of the deposit. The PEA had a positive NPV at US$20/oz silver, but the margins are too low (an IRR of 16.5%), and the grade used in the study being too low (e.g. average grade of 32 g/t Ag eq. using a 15 g/t Ag eq. cut-off in-pit). Not only that but Crux Investor questions the capital expenditure estimates and cash operating cost provisions, as we feel the ones used in the PEA are overly optimistic. Perhaps Discovery Metals would also have arrived at different CapEx and OpCost figures if it, not Levon, had been driving the PEA? Nevertheless, Crux Investor is a great believer in benchmark analysis and when our analysis uses industry standard operating costs for Mexico, and industry standard capital expenditure figures, the economic returns at Cordero are further downgraded and the deposit is clearly rendered even more sub-economic than it was previously. Ouch.
To their credit, Discovery Metals management are highly aware of the problem, with their stated motivation for the current drilling campaign being to better define, “a shallow, higher-grade component that could redefine the Project entirely and vastly improve its economics”.
The strategy of the Company is now very clear. Discovery Metals is focusing on a high grade core to improve the economics of Cordero. And on pages 9 and 10 of the current slide deck, the plan is laid out for all to see. Slide #9: Drill to define and delineate higher grade zones; do metallurgical testwork to better define the resource by domain (which bits will behave in which way and generate which types of concentrate); both of which will lead to a new resource model in H1 2021, complete with an optimised metallurgical flowsheet as part of an optimised PEA. Slide #10: Drill 50,000–55,000m; Target bulk tonnage mineralization, aiming to find higher-grades over broad widths and to focus on filling large gaps in previous drilling; and additional targets are high-grade feeder structures and high-grade veins potential previously overlooked.
This is all well and good. We like the approach, so it gets the formal Crux Investor Green Light of approval. But, but, but, but there is a but, which is whether the asset is worth the valuation being given to it.
The share price has run so hard and so fast that the current Enterprise Value of the company is US$519 million. The PEA from 2018 demonstrates that the project in its current form is marginal despite high silver prices, which has been acknowledged by current management. The Team is now in the tricky position of having to back-fill valuation by delivering some consistent and spectacular results to transform the economics of the project. And herein lies the problem, or rather three problems.
Firstly, drilling a limited number of high grade veins to sweeten the overall resource of a large tonnage bulk mining asset is challenged by mathematics. The aggregate volume of veins which have a width of, at most, 2 metres will be extremely limited. At the most optimistic aggregate strike length of 4 km, and a depth extent of 300 m with an average width of 1.5 m, the potential tonnage contribution is less than 5 Mt, or 0.8% of the tonnage of 615 Mt within the current PEA pit outline. Volumetrically tiny, the grade has to be consistently spectacular to reach the goal of “to vastly improve the economics”. By way of example, if 0.8% of the tonnage is a high grade vein running 1kg/t silver equivalent, it lifts the average grade from 31g/t Ag eq. to 39 g/t Ag eq. which is hardly transformative. In short, drilling out high grade veins alone does not move the needle.
And that is not the only problem. Let us run, for the moment, with the idea that the high grade veins can transform the economics of a bulk mining operation, and we run into a second major problem. From the cross-sections provided by the Company it is evident that high-grade structures are often in contact with waste, which would result in high dilution of the vein grade if mined using large equipment, greatly diminishing the grade impact. Furthermore, it seems as if the overall grade continuity within the proposed open pit area is questionable. For example, the drill results reported by Discovery Metals constitute less than 17% of the drill hole length and have a weighted average grade of 79 g/t Ag eq (when calculated based on payable metal in concentrate which is the method used in the PEA and the method preferred by Crux Investor). The highlighted higher-grade results in a weighted average grade of 231 g/t Ag eq. which covers 2% of the drill hole length. What these figures mean is that there does not seem to be enough mineralised material in general to make the resource hang together. Perhaps Crux Investor has got it wrong, for we only have access to public information, but from first principals it seems as if the resource will struggle to make it.
The third major problem that Crux Investor has identified is the question of silver equivalent grades, as touched on above. When ascribing equivalent grades, Crux Investor takes pains to identify what are the payable metals in concentrates, as these numbers feed into the cash flow statement and therefore affect Net Present Value calculations. Base metal concentrates typically have to pay treatment charges, refining charges and distribution (logistics) charges on some or all of their metal streams, which together are known as Realisation Charges. For this report, and for analysing the more recent drill results, Crux has calculated silver equivalent grades using spot metal prices and either PEA-provided or industry-standard realisation charges. We note that the PEA was carried out using industry-standard realisation charges. An independent consultant signing off with responsibilities and liabilities will always report the conservative number, something which an issuer does not have to do. Companies can report a headline equivalent grade, or an equivalent grade after metallurgical recoveries. We use the equivalent grade that the company can expect to receive as reflected in dollars and cents.
We note that the recent drill results do accommodate payable metal after metallurgical recoveries but do not accommodate payable metal after Realisation Charges, which leads to a significant downgrade in the silver-equivalent grade, as the base metals and gold contributions are so small. Cordero is, absolutely, a silver project that (lives or) dies by its silver grade alone.
It is interesting to note that the charismatic and talented CEO, Taj Singh is a mining engineer, and the brains behind the technical re-evaluation of the deposit is highly respected geologist Gernot Wober. Neither of them is a metallurgist and one of the key weaknesses of the project is the metallurgical fact of realisation charges.
Putting all of this together, and then undergoing a review of cross sections with new drill results does not instil confidence in the asset. Holes in close proximity to each other have often distinctly different grades and large sections of internal waste. Rather than finding that new drill results support the resource, the more analysis that is done, the weaker the overall resource looks. Crux Investor finds it hard to follow the consultants thinking in the PEA and associated resource estimate, especially one with a prospective waste strip ratio below 1.0 and the suggested average grades. This is not a Good Thing.
It is time for Gernot Wober put all his geological experience to the test, and to call on Lady Luck. As the legendary diamond geologist John Gurney said, ‘luck favours efficiency’. With things as they are, and incorporating the upgrades from this 2019/20 drilling campaign there is little prospect for the grade of the global resource base at Cordero to be materially revised upwards. There needs to be a step change in the tenor and breadth of mineralised intercepts at Cordero.
So, if a large, bulk tonnage is not possible, then perhaps a small underground project might work? Indeed it might, but remember that the Company is running with an EV of US$519 million. Recasting the project around a high grade core will force the Company away from using banners such as “world class asset…. one of the largest development-stage silver projects in the world” which is currently the first thing that pops up in the middle of the homepage on the website. A small high-grade operation is neither world class, nor large. Nor will it command an EV of US$519 million. Cordero in Spanish means lamb. Feel free to insert your own terrifying well-known phrase or saying referencing lambs.
Who ever said finding world class assets was easy? No-one.
All is not lost, however. Discovery Metals has many, many things going for it. CEO Taj Sing is driven, bright, and ambitious, and he is backed up by not only an excellent, real deal, geologist in Gernot Wober, but crucially by the Oxygen Capital group. In addition, the Company has a fabulous balance sheet, a superb shareholder register, and stacks of cash. That C$80 million in cash goes an awfully long way, and it may, in the end, prove to be a trump card. It will be fascinating to watch what this talented management team turns to next, after roast lamb.
Introduction
Discovery Metals Corporation (“Discovery Metals”) (OTCQX:DSVMF) (TSX:DSV) is a Canadian company incorporated in 1986 which in April 2017 after a number of changes in name and business purpose became Discovery Metals focused on mineral exploration and development.
The transactions entered into in April 2017 were exploration and option agreements with two private Mexican vendors for the Puerto Rico and Renata properties in Coahuile, Mexico. These were followed in May 2017 by concluding an additional option agreement for four concessions, two of which are referred to as Minerva and Monclova.
During the financial year ending 31 December 2018 Discovery Metals carried out underground sampling at three mines on the Puerto Rico property: the eponymous Puerto Rico mine, the San Jose mine and the Zaragoza mine. At the same time a magnetic geophysical survey was completed at Monclova and mapping and channel sampling of surface outcrops at Minerva.
In August 2019 Levon Resources Limited (“Levon”) was acquired by way of a plan of arrangement for a total consideration of C$26.3 million paid for by exchanging 0.55 Discovery share for every Levon share, option and warrant. With the takeover Discovery controlled the Cordero project, a very large but low-grade silver deposit in the Chihuahua State if Mexico. Soon thereafter Discovery commenced a “Phase 1” diamond drilling programme on the property.
Also during 2019 surface mapping and sampling in addition to underground sampling was carried out at Minerva and Monclova. The company planned to drill at Monclova before the end of 2019. For Puerto Rico Discovery was in the final stages of a land re-designation process in order to be able to apply for drilling permits for the project. The Puerto Rico option agreement was amended to account for delays in obtaining the drill permits. In general the cash component of the option commitments and purchase price dropped.
Throughout the first half of 2019 the company announced results of the Phase 1 drilling at Cordero which varied from wide, low-grade intersections to very short high-grade intersections.
Figure 1_1 shows the share price performance of Discovery Metals over the last 5 years on the Toronto stock exchange (“TSX”). For the purposes of this report the period before April 2017 is immaterial.
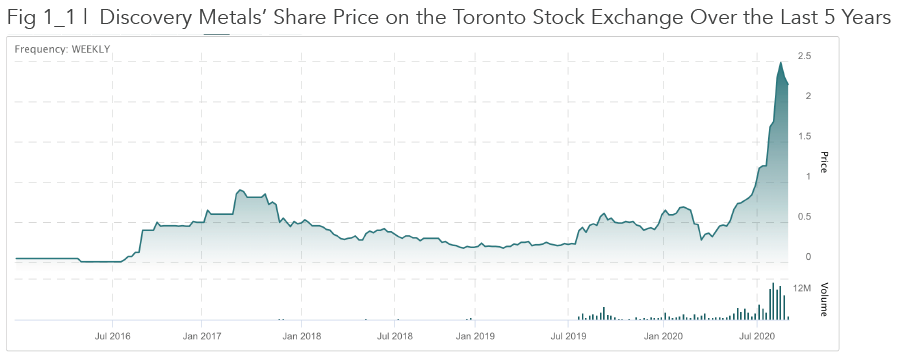
What caused the share price to rise before April 2017 seems to be related to a reorganisation with new management installed, a capital raising and debt forgiveness. The change of business had an immediate positive impact, but for a short period after which there was a long downhill trend until mid-July 2019. The exploration results at Puerto Rico and other properties did not get traction with the market but this all changed with the Levon takeover. From the middle of last year the share price has been on an upward trajectory (complete with a coronavirus dip in March), which accelerated strongly from April of this year.
The price graph clearly indicates that Discovery Metal’s value is all about the Cordero project. And so this report will focus on Cordero and ignore the other, early-stage assets.
Historical Financial Performance
With such a short history reviewing the financial history is of little relevance. Table 2_1 summarises the financial statements since 1 September 2016.
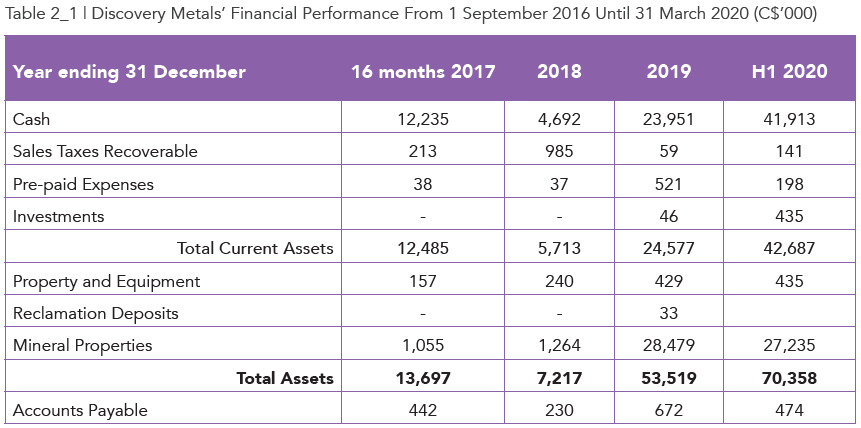
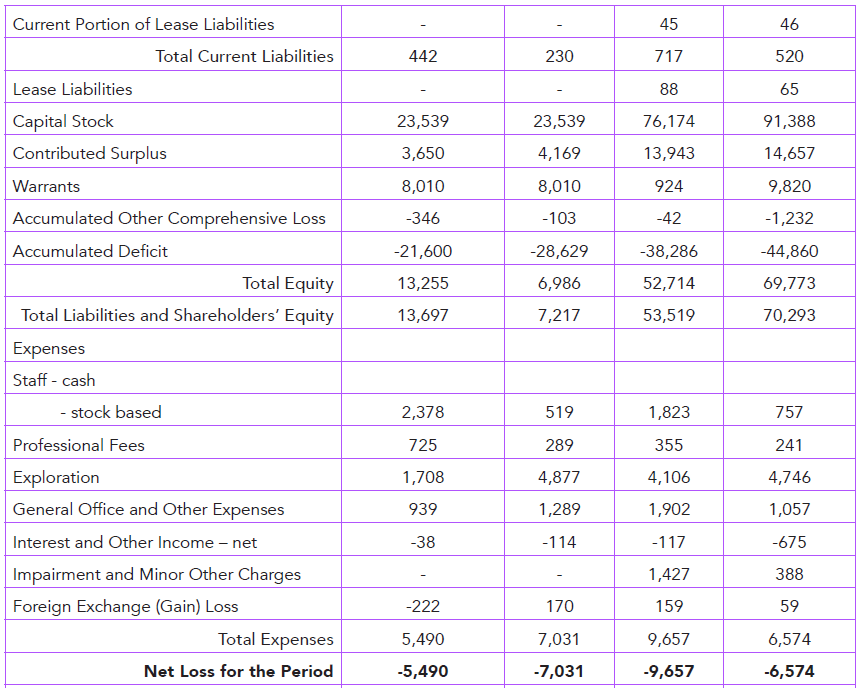
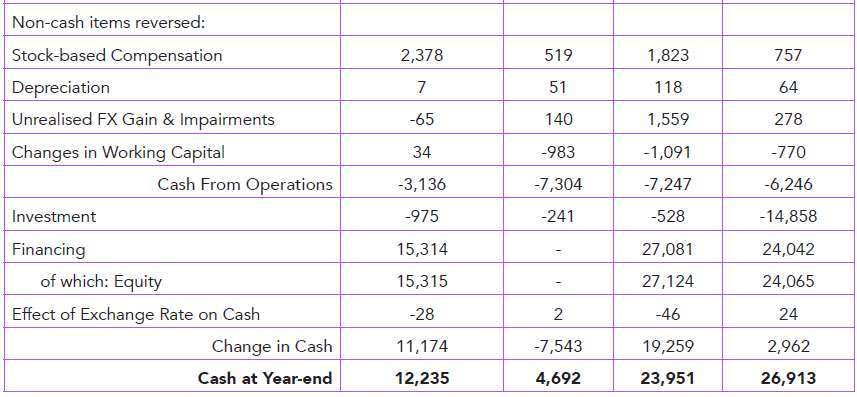
Table 2_1 illustrates:
- The large jump in Mineral Properties balance during 2019 with the acquisition of Cordero.
- The rapid increase in cash expenditure on exploration, being between US$4 million and US$5 million in 2018 (on Puerto Rico, Monclova and Minerva) and in 2019 (the same properties and start of drilling at Cordero) to the same expenditure level in only one quarter in 2020 with the acceleration in drilling at Cordero.
- Expenditure on exploration is expensed, not capitalised.
- The expenses on corporate overheads is currently US$2 million per annum.
- The cash burn rate is approximately US$40 million per annum.
- Not evident from the table is the large additional fund raising after 30 June 2020 for a total of C$35 million before costs associated with the equity placements. The level of funding could see the company through for a long time if they choose to husband treasury in the near term.
Review Of The Cordero Project
Background
For much of the information reference was made to a NI.43- 101 compliant technical report by M3 Engineering & Technology Corporation (“M3”) in support of a preliminary economic assessment (“PEA”) of the Cordero Project, dated 18 April 2018, commissioned by Levon. Unless specifically otherwise stated all information, illustration and wording has been extracted from this report.
This section will evaluate the Cordero project on the basis of the resources considered by the PEA and the following section will determine whether the 2019/20 drilling results materially affect the value.
The Cordero project is located in the State of Chihuahua in North Central Mexico approximately 180 km south of the city of Chihuahua, and approximately 35 km northeast of the mining town of Hidalgo del Parral (Figure 3.1_1).
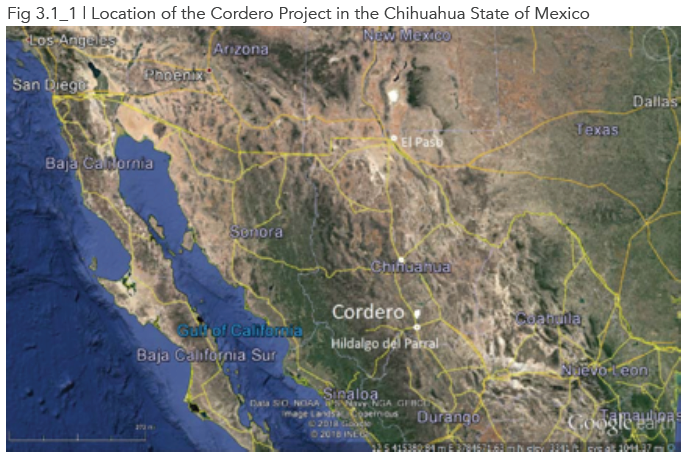
The project is accessed via State Highway 24 with the last 10 km dirt road.
Figure 3.1_2 shows the extent and outline of the tenement area.
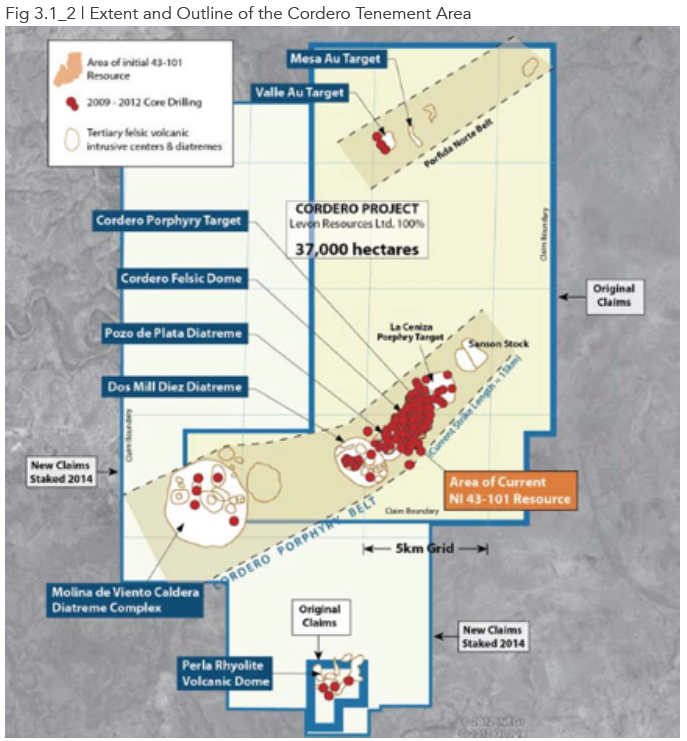
The original area shown in light yellow measures approx. 20,000 hectares (“ha”) was secured by Levon in 2013 and 2014. Subsequently an additional 17,170 ha to the west and south (shown white) were staked in order to cover the prospective strike extensions of what Levon considered to be mineralised belts.
The mineral rights have largely been secured by staking contiguous lode claims that cover approximately 37,000 hectares (“ha”). Only two small inlying claims in the district are not owned by Discovery Metals. These two claims are deemed of no consequence by Discovery Metals since they are situated outside the southern fringes of the Perla prospect along the south margin of the property. The staked properties are not encumbered not royalties, but some of the original rights are, the outlines of which are shown in Figure 3.1_3.
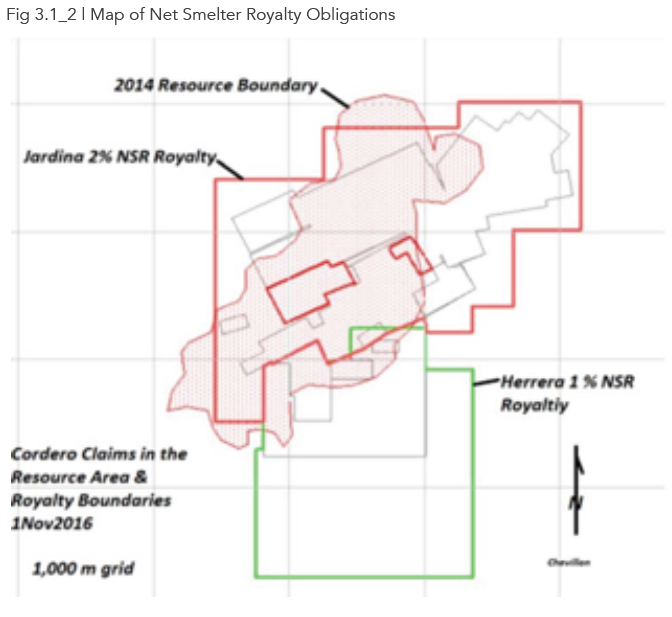
The red shaded area is the surface projection of the 2014 mineral resource boundary illustration the 2% NSR generally applicable, some of which subject to the right of repurchase by Discovery Metals.
Geology and Mineralisation
The Cordero project covers a belt that presently consists of seven known igneous intrusive centres aligned within a northeast trend 15 km on strike and 3-5 km wide. The intrusive centres have somewhat awkwardly been named from southwest to northeast (see Figure 3.2_1):
- Moleno de Viento Caldera and Diatreme
- Dos Mil Diez Diatreme
- Pozo de Piata Diatreme
- Cordero Felsic Dome
- Cordero Porphyry Zone
- La Ceniza Stock
- Sanson Stock
Fortunately, for the purposes of this report only the names from this list that are shown in bold are the intrusives of relevance as these contain the mineral resources.
The mineralisation at Cordero is related to porphyry style intrusives which are systematically deeper toward the southwest end of the belt. In the northeast the mineralisation is visible in outcrop, whereas in the southwest the mineralisation is emplaced at a depth of a kilometre. The bottom illustration in Figure 3.2_1 is a longitudinal section through the intrusives to show this deepening trend to the southwest.
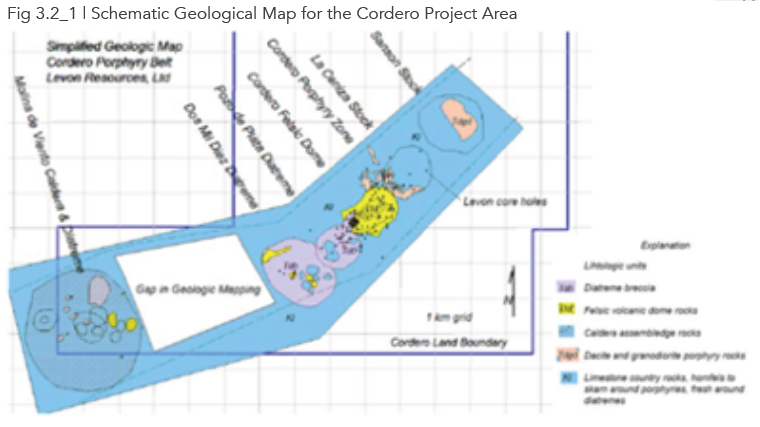
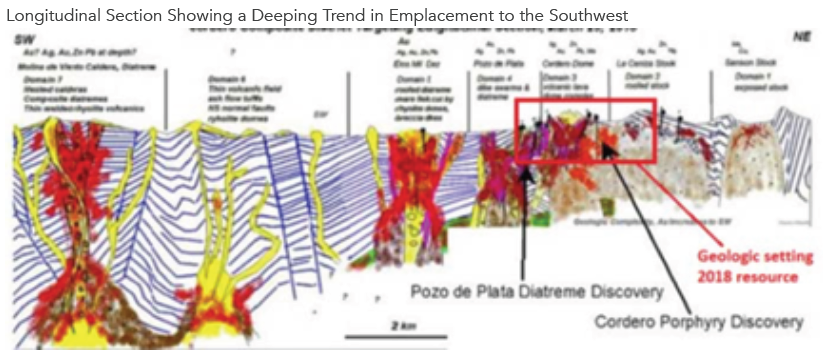
With the variations in emplacement mode for each centre the associated mineralisation differs, requiring a different exploration approach. The longitudinal section illustrates the geological setting of the 2018 mineral resources, all related to intrusive stocks that outcrop.
Mineralisation within the Cordero Resource is porphyry-style disseminated, stockwork veining sulphides within the intrusives, associated contact replacement and skarn type mineralisation (= calcareous rock altered by mineralising fluids) and discordant, through going veins (1 m - 2 m widths) with up to 500 m strike lengths. Diatremes within the resource are characterised by disseminated sulphides in mineralised breccia matrix material, stockwork veined and replaced clasts and late stockwork veins that entirely cut the mineralised diatreme breccia.
The Cordero Porphyry Zone mineralisation includes disseminated and stockwork vein, porphyry style mineralisation and diatreme breccia mineralisation, particularly in contact zones with limestone country rocks. At the Cordero Felsic Dome there is in addition to porphyry style mineralisation and stockwork veining a high-grade contact breccia with a width of 1-15 m. The Pozo de Plata Diatreme occupies an area of 1 km in diameter and is a trough-shaped body measuring 800 m x 800 m x 400 m. It contains mineralised swarms and massive sphalerite (ZnS) stockwork veins.
The minerals of economic interest are dominantly silver-bearing galena (PbS), sphalerite and pyrite (FeS2) present in roughly equal proportions. Other minerals associated with silver are stibnite (Sb2S3), tetrahedrite ({Cu,Fe,Zn,Ag}12,Sb4S13) and arsenopyrite (FeAsS). These antimony and arsenic containing minerals could spell metallurgical trouble for an operation. Deleterious elements need to be carefully evaluated through metallurgical testwork as they may incur penalty charges during downstream treatment.
Oxidation of sulphides generally is present within 2 m to 60 m of the present surface from drill hole information. Some narrow fracture zones are oxidised at depths of >600 m. Oxidation could add to metallurgical complexity.
Mineral Resources and Conversion Factors
This section may seem technical and boring, but it is crucial to understanding the value of the Cordero project. Sit tight, declutter your mind, and stick with us.
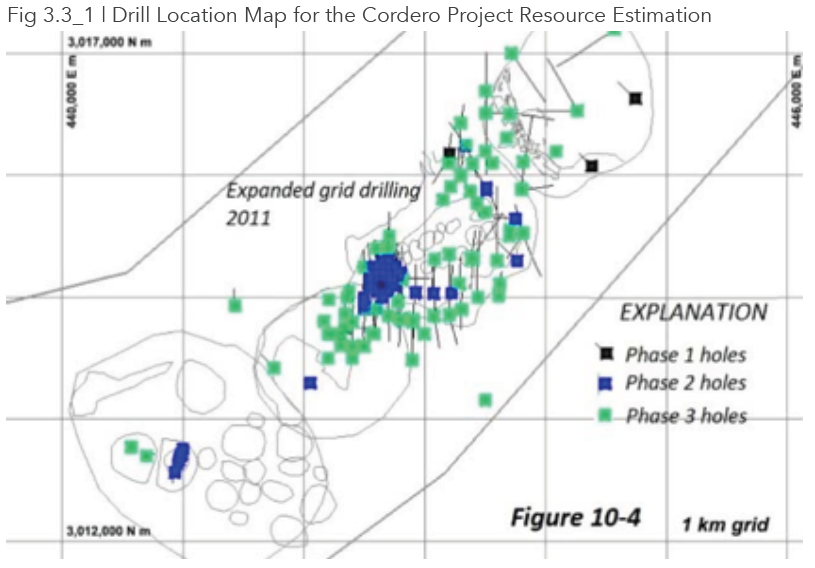
The Cordero February 2018 mineral resource estimate is based on 281 drill holes completed through September 2017 and including 18 holes drilled since the September 2014 mineral resource estimate. Figure 3.3_1 shows a map with the localities of the holes of the various drill phases for the Cordero resources area.
It is difficult to see whether a geological model was used for the estimation, or not. It appears that the resource was calculated on a low-grade equivalent threshold of 15 g/t silver equivalent, which may be appropriate when considering a ‘global’ mass of rock that is broadly anomalous. The various lithologies have distinctly different average grades, but according to M3 (the PEA resource consultants) the contacts between the lithologies could not be established as coherent shapes. Hmmm. This has the effect of dragging the resource down to the lowest common denominator of a broad silver anomaly and makes it difficult to remodel the deposit on different (lithological?) criteria.
The next key aspect of the model is the way that the Company and its consultants approached the calculation of the Conversion Factor to enable the provision of a Silver Equivalent (“Ag Eq.”) grade. Silver equivalence is a vital component of economic evaluation of a deposit like Cordero. If, on average, each tonne of ore is given a meaningful economic boost by the presence of base metals or gold, then it enhances the silver equivalent grade.
For example, if silver is trading at $25/oz and one can recover four ounces of silver from every tonne of rock, then logic suggests that the company receives $100 per tonne. Hurrah, and trebles all round. If an additional $50 per tonne is derived from other metals (Pb, Zn, Au), then $150 per tonne is received (hurrah again), and the silver equivalent grade is six ounces of silver for every tonne of rock (because the money received per tonne is six times the value of one ounce of silver, even though silver itself only contributed 2/3 of the total). When, as in the case of Cordero, the grade is not four or six ounces of silver per tonne of rock, closer to half an ounce (there are 31.1 grams in a troy ounce), then the numbers look a lot skinnier. Half an ounce of silver at $25/oz is $12.5 per tonne. Which is not a lot. At this point, the silver equivalent figure is a critical factor. Do the other metals contribute enough to give a sub-economic resource the boost to turn it into an economic resource?
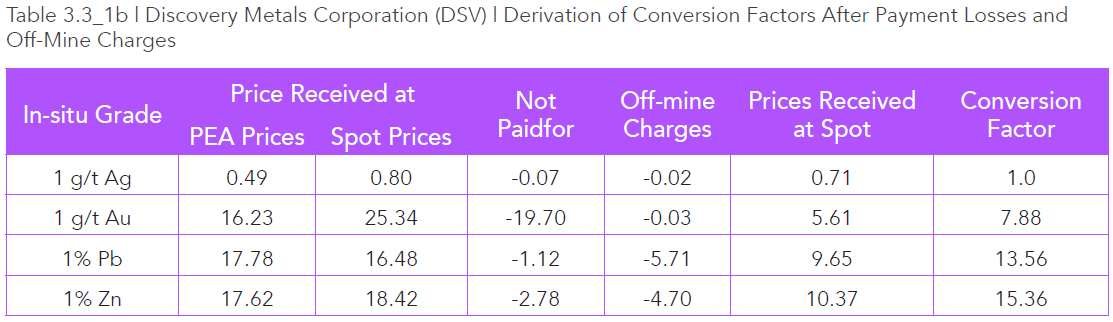
First up, let us look at how Discovery Metals calculates the conversion factor, or the rationale behind their Silver Equivalent ounces. Table 3.3_1 gives the ratios to convert metal grade to Ag Eq grade and the input parameters for the conversion.
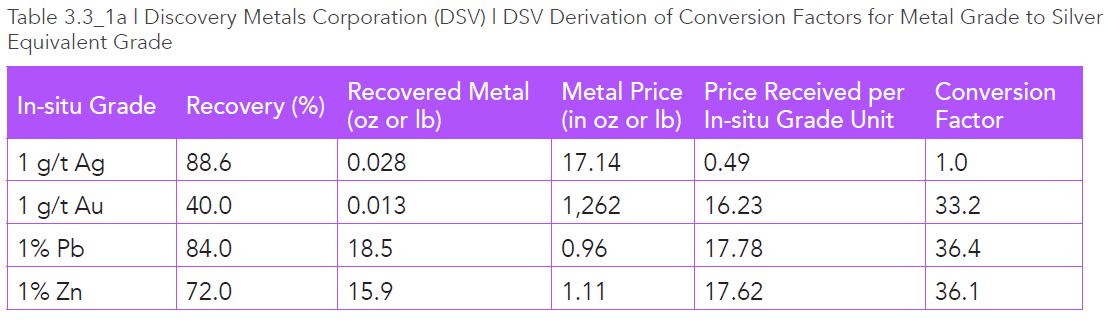
What this table shows us is that in the PEA figures, the assumed silver price is high compared to the gold price. When using the metal spot prices on 1 September of US$28.1/oz Ag, US$1,970/oz Au, US$0.89/ lb Pb and US$1.16/lb Zn the ratios to convert gold, lead and zinc would be respectively 31.7, 20.6 and 23.0, raising the importance of gold and reducing the importance of the base metals.
This is ok as far as it goes, but the real ‘Crux Investor’ moment is the realisation that these silver equivalent grades do not take into account Realisation Charges. It should not come as a surprise to industry watchers that base metal concentrates have to pay treatment charges, refining charges and distribution (logistics) charges on some or all of their metal streams. Together these accumulated costs are known as Realisation Charges, and they affect the final value of the product as much as metal-in-the-ground-adjusted-for-metallurgical-recovery.
Realisation Charges
Did you know, for example, that for a lead concentrate, the smelter will take a minimum of 3% of the lead, and approximately two ounces of silver and two grams of gold as standard from every tonne of concentrate? This means that if your concentrate is grading 4g/t Au, after 40% recovery, you then have to give away 2g/t to the smelter (50% of your gold in concentrate), which means that you end up with just 20% (40% x 50%) of the in situ gold that you started with. And that is nothing compared to what happens with zinc concentrates.
Have you ever wondered why zinc companies seem to trade on such low valuations? Well the answer is that zinc producers get rough treatment from smelters. A standard contract would see 8% of the zinc in concentrate go to the smelter, plus 3g/t of any gold, and a whopping 120g/t (~4 ounces) of any silver.
What this means is that at Cordero, the ‘payable’ contribution from gold and lead and zinc is much smaller than ‘recovered’ contribution from gold, lead, and zinc. And unfortunately it is the payable contribution from these metals that are the real world inputs into any cash flow analysis. On that basis, and for this report, and for analysing the more recent drill results, Crux has calculated silver equivalent grades using spot metal prices, PEA-provided recoveries and industry-standard Realisation Charges. As it happens the PEA was carried out using industry-standard Realisation Charges, so we have been able to use the Realisation Charges that are provided in the PEA.
Below is a table that shows these Realisation Charges and how they affect the ‘conversion factor’ that contributes to a Silver Equivalent grade.
With much of the recovered gold not paid for because of minimum deductions and the base metals incurring substantial treatment and transport charges, their relative contribution drops substantially from the amounts suggested in Table 3.3_1A. In particular gold’s contribution is affected.
Putting the Discovery Metals (DSV) and the Crux Investor Report (CIR) conversion factors side by side, you can see that Discovery Metals ascribes much greater value to the other metals than Crux does. The way that the table works is that is shows how to convert a unit of any given metal into silver equivalent grade taking into account metallurgical recovery, and realisation charges. So, for every one gram of gold shown in drill core or in assay, DSV ascribes 33.2 ‘silver equivalent’ grams per tonne, but Crux only ascribes 7.9 ‘silver equivalent’ grams per tonne, because of the punitive treatment charges for gold in lead and zinc concentrates. Similarly, for every 1% of lead in assay in samples, Discovery ascribes 36.4 ‘silver equivalent’ grams to the total, whereas Crux only ascribes 13.6 ‘silver equivalent’ grams per tonne. And so on. Zinc costs more to treat so there is less value for Discovery Metals. For every percent of zinc in concentrate, Discovery ascribes 36.1 g/t Ag Eq. whereas Crux calculates that after realisation charges, 1% of zinc in concentrate is only worth 15.4 g/t Ag Eq.
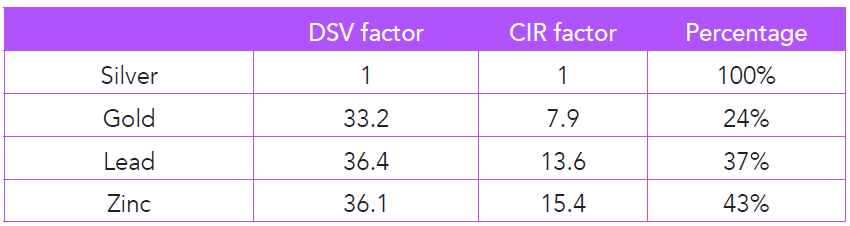
The long and the short of it, unfortunately, is that these lower conversion factors mean that Cordero gets much less support from its gold, lead and zinc contributions than the headline numbers suggest. It is not wrong for Discovery Metals to report silver equivalent grades after metallurgical recoveries only, it is just not the whole story.
We note that the recent drill results do accommodate payable metal after metallurgical recoveries but do not accommodate payable metal after Realisation Charges. When Realisation Charges are incorporated, there is a significant downgrade in the silver-equivalent grade, as the base metals and gold contributions are so small. Cordero is, absolutely, a silver project that (lives or) dies by its silver grade alone.
The next section is for those that love their geostatistics only. It may be nitty gritty and complicated, but it is revealing.
Digging into the PEA available on the Discovery Metals website, one can see on page 108 that the consultants introduce the subject of top-cuts (capping super-high grades, to facilitate resource estimation). Upon review of the assay grade statistics, the consultants applied grade caps for the key metals, which were: 1,150 g/t for silver, 6.0 g/t for gold and 16% for both lead and zinc. Following the capping of the grade and subsequent compositing to 10 m, the statistics show a drop of the coefficient of variation (“CV”, being standard deviation / mean) to 2.43 for Ag (from 4.06), 2.46 g/t for Au (from 4.11) and 2.64 for Pb (from 4.01) and 2.03 for Zn (from 2.96).
For a supposedly bulk mineable resource, these are high values for the base metals, which ideally should have CVs of below 2. It is possible that the high CV of base metals at Cordero is because the mineralisation is found in narrow, potentially discontinuous structures such as veinlets and veins that are not representative of a bulk mineable deposit like a stockwork. It raises a concern about the validity of the resource estimate, and a detailed explainer is provided below.
Crux Resources Explainer – Coefficients of Variation
The Coefficient of Variation is a measure of how closely grouped a particular data set is around its mean value. For a Gauss curve – the standard bell curve of distribution – a few examples are shown in this figure:
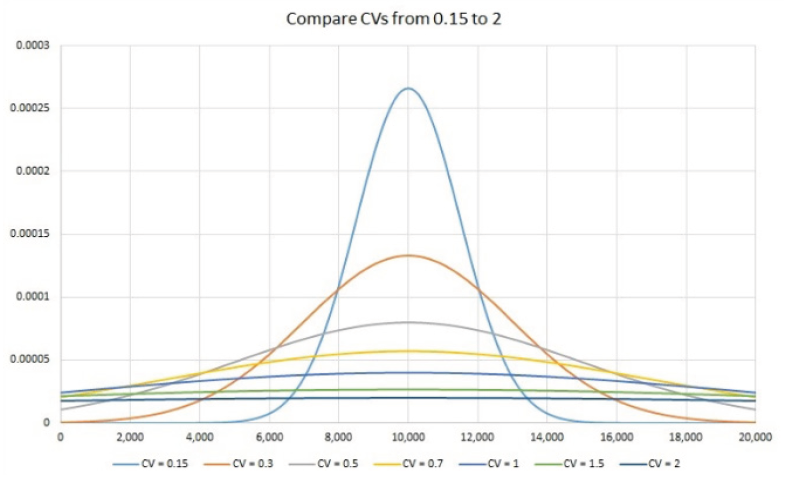
Looking at the curves it should be clear that when the CV is high, the standard deviation is high in relation to the mean (there is a large spread around the mean). This leads to the result that the mean is determined by values that vary significantly, both high and low, from the mean. Conversely, a low CV has a population tightly grouped around the mean. By definition, within any population values higher than the mean are compensated for by values lower than the mean.
However, when data points are limited the histogram may not be symmetrical and individual values can have a disproportional effect on the mean. The standard bell shape of distribution, The Gauss Curve, applies to the grades of rock building elements such as Na, K, Ca, Mg, etc.
For trace elements such as gold the natural distribution is skewed. Trace elements typically have a log-normal distribution with the logarithmic values having a Gauss curve shape, as per the relationship in the illustration below.
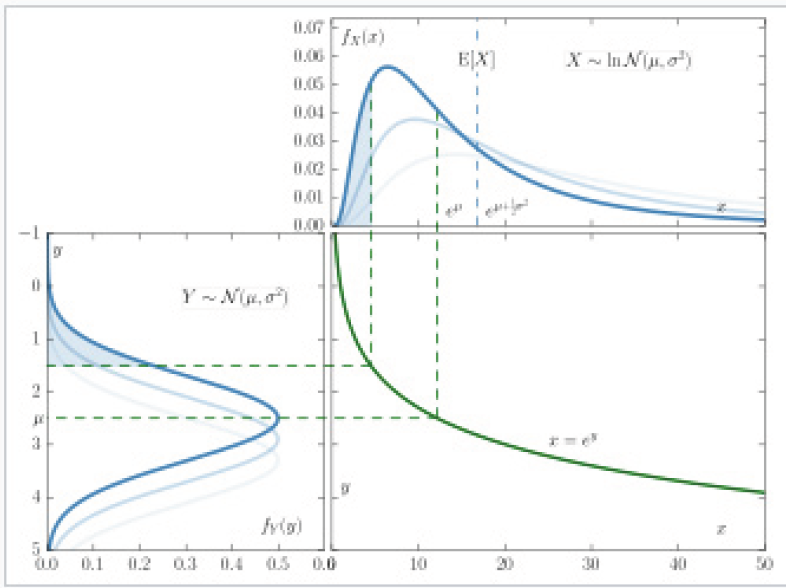
What this means is that the mean in a log normal distribution is even more determined by high values in the “tail” on the right, and being lognormal, the mean is not compensated for by low values on the left of the population. The higher the CV, the more extreme is the effect of a few high grade samples on the mean of the population. It is for this reason that the industry typically caps high grade value - to reduce the impact of a small number of ultra-high grades on the overall mean grade of a resource. When grades are subject to an appropriate top-cut, the viability of the project does not stand or fall on a few high grade values alone. In order to truly understand grade populations appropriately large data sets are required, which is why bulk sampling is such a key step in evaluating high variability resources. In the case of some deposits, the true grade will only be determined at the mine-scale, which is not necessarily the basis for a good investment. Prudence would suggest making sure that the resource stacks up even with a healthy top-cut, and not relying on the high-grades to make it a success.
When a standard top-cut renders a project sub-economic, Com¬panies tend to get creative, viz projects such as Brucejack, Aurora and Moose River that have used “clever” geostats to still include these few high value numbers by estimating methods such as Multiple Indicator Kriging. When you see that method used, take extra care.
The key point is that gold assay histograms will typically have very “positively” skewed shapes. The higher the CV, the more risky the block estimation becomes as the tail will have a larger influence on the average grade for the deposit. For ordinary kriging you would like to have a CV of 2 or lower for trace elements to have confidence in the result. This you accomplish through compositing (which averages out extreme values) and cutting high grades, the threshold of which you establish using various techniques, among others the impact on the CV for the data base.
Whereas trace elements often have very skewed distributions, base metals tend to be more normally distributed, becoming more like rock building elements. When you find base metal values with CV’s above 2 you start to get concerned about the validity of the estimation. It is possible that the high CV of base metals at Cor¬dero is because the mineralisation is found in narrow, potentially discontinuous structures such as veinlets and veins that are not representative of a bulk mineable deposit like a stockwork.
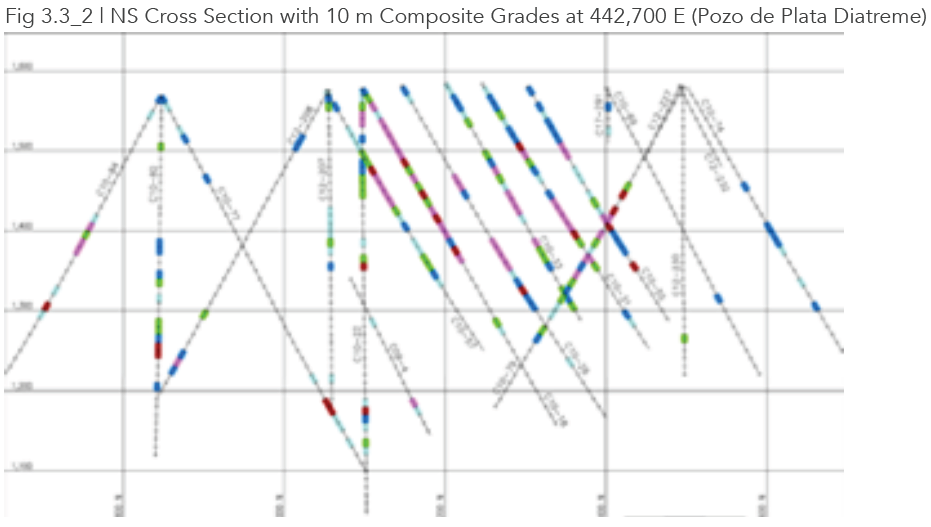
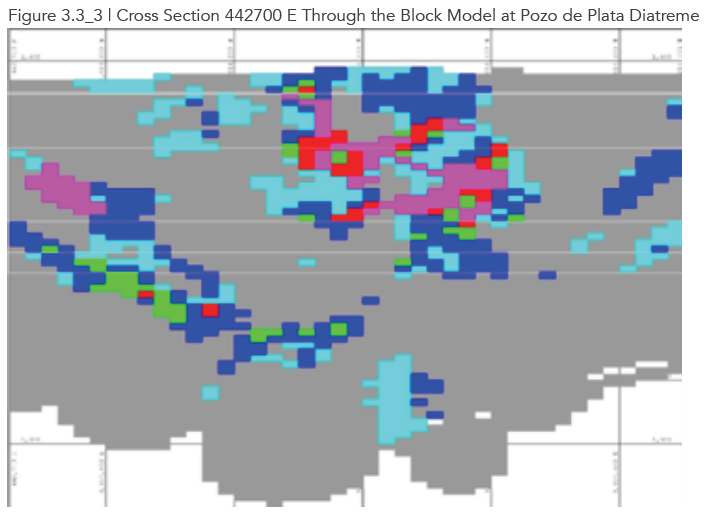
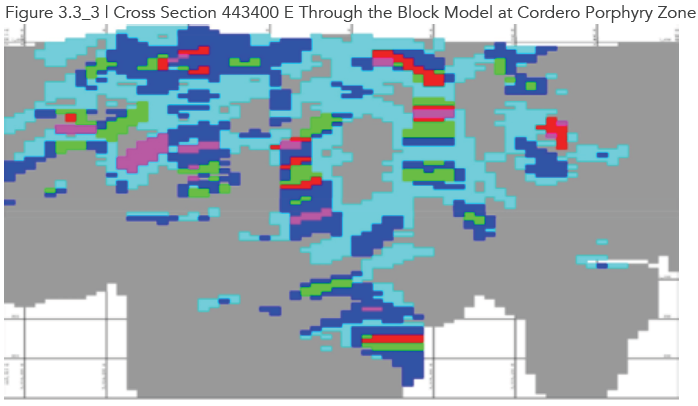
The technical report includes two cross sections, reproduced in Figure 3.3_2, illustrating the erratic nature of the composite Ag Eq. grades. The red and magenta colours indicate grades above 75 g/t Ag Eq, and simply looking at the cross-sections shows that the distribution is erratic.
Variograms run on 10 m composites for the various metals showed ranges of generally around 200 m in the horizontal and vertical directions and variable nugget levels. The omnidirectional variogram for silver has a range of 240 m. In geostatistical terms, the ‘range of the semi-variogram’ (often shortened to variogram) is a mathematical expression of how closely the grade at one point relates to the grade at another point, and the range is essentially the spatial limit of influence. For example, drill-hole data can be used help predict the silver grade of a block up to a distance of 240m away at Cordero. Running this process many times, and using different modelling techniques, and using every data point available is the art and science of resource estimation.
For grade estimation a block size of 25 m x 25 m x 10 m was chosen. M3 elected not to use ordinary kriging, but indicator kriging, which again points to complexities in estimation, never a good sign. As a reminder, the basic idea of kriging is to predict the value of a function at a given point by computing a weighted average of the known values of the function in the neighbourhood of the point. Indicator kriging is a more complicated calculation used in more complex scenarios, in an attempt to better estimate transition probabilities.
The ranges defined by the Consultants were grouped into three bands: 0-10 g/t Ag Eq., 10-50 g/t Ag Eq. and => 50 g/t Ag g/t. Indicator “pod” boundaries were defined for the three grade classes and “hard” boundaries used for the grade estimation. This means the grade outside a particular pod was not used to inform on the grade for a block in that pod. The search radii for the highest-grade pod were shortest at 70 m, 130 m for the middle range and 150 m for the lowest range, all with a 30 degree east of north orientation and 60 degree dip.
Only 2% of all the blocks were found to be in the highest-grade category class and 22% in the middle grade class.
The input parameters used for the constraining pit shells of the Cordero mineralisation to determine the potentially economical are summarised in Table 3.3_2.
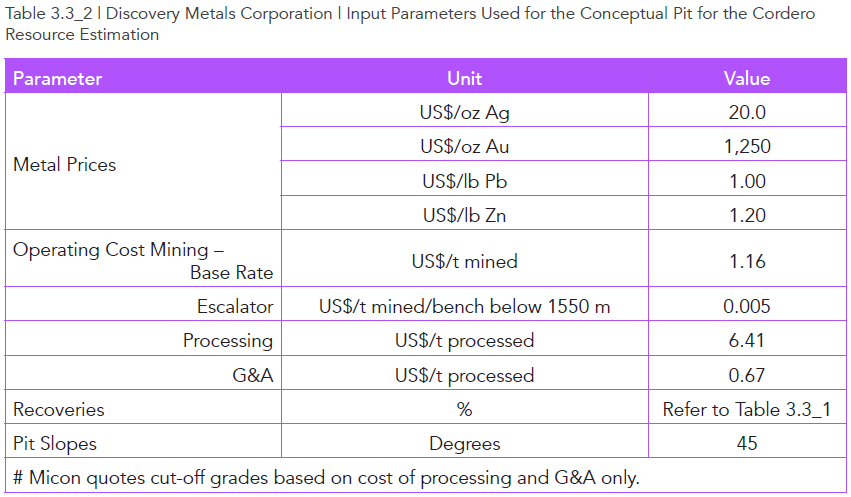
From the table above, we can see that operating costs are low. Mining costs are estimated at being less than standard industry rates, and processing and G&A are also low cost. The very low assumed operating cost rates are to some extent compensated by the precious metal prices, which are distinctly lower than current spot prices.
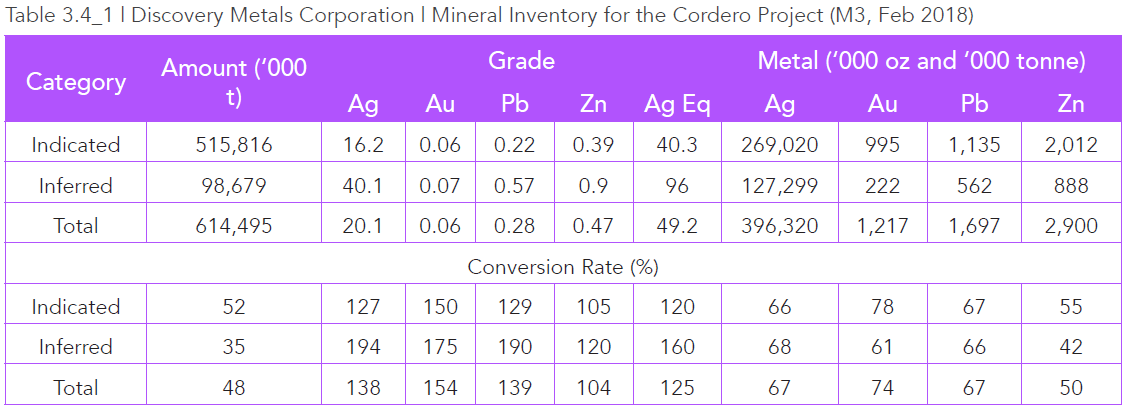
Table 3.3_3 is the resource statement for the Cordero project, effective February 2018 at an incredibly low cut-off grade of 15 g/t Ag Eq (at current silver price equal to an in-situ value US$12.0/t).
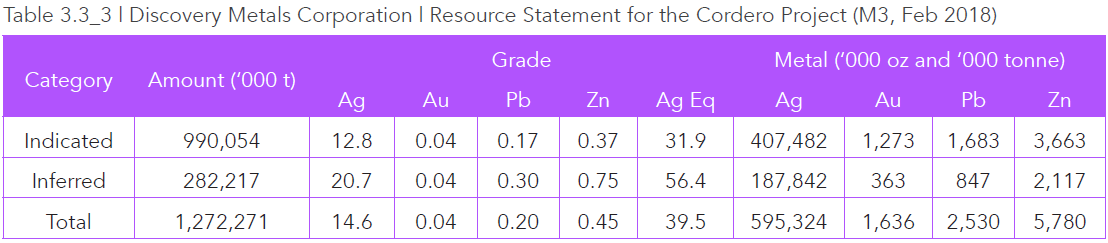
Crux Investor actually thinks that M3 got the Ag Eq. grade calculation wrong and slightly undercooked the grades in the table above. When we run the numbers, we arrive at figures of 33.7 g/t Ag Eq, for Indicated Resources and 60.0 g/t Ag Eq. for Inferred Resources when using the conversion factors in Table 3.3_1.
Somewhat surprising in the light of the difficulty to generate a geological model and the erratic nature of the grade, the tonnage proportion classified as Inferred Resources is small at 22%.
The technical report gives the sensitivity of the resources to changes in the cut-off grade with the CEO of Discovery Metals pointing out in an interview with Crux Investor that at a cut-off grade of 50 g/t Ag Eq. there are still substantial resources of 200 million tonnes. What was not said is that more than half this tonnage is in the Inferred category, which accounts for an even higher proportion of the metal content.
Moreover, as is evident from the cross sections through the block model in Figure 3.3_3, the +50 g/t blocks (in green, red and magenta colours) are widely dispersed and not mineable as a single consistent deposit, therefore highly unlikely to be economic.
Wrapping up our conclusions on the mineral resource, Crux Investor can say that the Cordero project is a very large, but low-grade polymetallic deposit with the precious metals accounting for 41% of the recovery-adjusted-in-situ value. Unfortunately, when payable metal is considered, after realisation charges, the gold and the base metals contribute far less to the resource, rendering it a very low-grade silver resource.
Mining and Mineable Inventory
Mining of the Cordero deposit is envisaged by conventional open pit mining utilising a traditional drill, blast, load and haul sequence to deliver mill feed to the primary crusher and the waste to waste dumps located to the north and south of the proposed pits. The pit design is based on a 10 m bench height to match the resource model bench height.
The mine plan calls for the delivery of 40,000 tonnes per day (tpd) of material to the mill for a 29-year schedule and during peak production about 100,000 tpd of total material (mill feed plus waste) being mined.
Digging further into the detail Crux Investor notes that the cost assumptions used for the pit design were different to the cost assumptions used for the resource estimate. The recovery and metal price in parameters for the pit design are the same as the parameters used for the conceptual constraining pit for mineral resource estimation, but they differ substantially for cost assumptions with mining unit cost of US$1.55/t mined as base rate, US$0.008/t per 10 m bench escalator, US$6.97/t for processing and US$1.55/t G&A. This resulted in a cut-off grade of 20 g/t Ag Eq. If you refer back to Table 3.3_2, the costs were US$1.16/t mine, an escalator of US$0.005/t, US$6.41 for processing, and US$0.67/t for G&A, with a cut-off of 15 g/t Ag eq. Again, what this means is that the resource is questionable, and that cost control for the pit design are not yet nailed down.
No pit optimisation results graph is presented in the report. The mineable inventory is given in Table 3.4_1 together with the conversion ratios for tonnage and grades and metal content. There are also some aggressive numbers in these mineable inventory figures, which shows that the consultants were pushing hard to make the project work. Sadly, real life does not always work that way, and no matter how hard consultants push a project, sometimes the geology in the ground cannot be circumnavigated.
From the table above, one can see that of the precious metal in total resources more than two thirds is captured in the mineable inventory at a grade than is approximately 40-50% higher than the average grade of the deposit. This is unlikely to be explained by the increase in cut-off grade by 33% mentioned earlier in this section. Crux Investor believes that the difference must, in part, be due to a shape of the pit being used which is different to the conceptual mineral resources pit. Another alarm bell rings in the way that the inferred resources (by definition a category with lower confidence) has a higher conversion rate than the Indicated Resources
Metallurgy and Processing
Metallurgical Testwork
Testwork was carried out in 2011 on 12 composite samples from drill hole core material.
Mineralogical examination revealed galena and sphalerite to be the main economic minerals, present in highly variable grain sizes ranging from very coarse to extremely fine grained. The sphalerite contains minute inclusions of chalcopyrite (CuFeS2), which could possibly result in penalties from the smelter should the copper content exceed threshold levels.
Galena is intergrown with gangue minerals and may require additional attention to achieve the desired degree of liberation.
Comminution tests showed that the mineralised material has average hardness (Ball Bond Work index of 9.7 kWh to 15.4 kWh, averaging 12.4 kWh) and low abrasiveness (the index averaging less than 0.10) and variability typical of a large porphyry system.
Rougher flotation testwork was performed on the 12 composite samples, ground to 80% passing (P80) 74 μm, showed generally excellent recoveries of Pb (average 93.6%), less so for Zn (average 80.6%) with 84% of the silver reporting to the lead concentrate and gold split equally to the lead and zinc concentrates for an overall recovery of 40%. Of concern here is the high average head grades of lead and zinc at respectively 0.64% and 1.02% Zn compared to their grades of 0.28% and 0.47% in the mineable inventory. The composites cannot be considered representative of the planned plant feed.
Closer examination of the individual composite results showed that gold reported with the pyrite (FeS2) because the gold and iron recoveries were similar in all the samples.
Flotation tests on three composites (again not representative of the mineable resources) for different grain sizes showed a grind size coarser than 74 μm to have a detrimental impact on recovery.
Concentrates of certain composites were found to exceed penalty levels for Cd in Zn-concentrate and Sb in Pb-concentrate.
No cleaning flotation tests were carried out, which raises questions as to the metallurgical recoveries that can be expected from an industrial-scale operation. Normally there are recovery losses during the cleaning process after rougher flotation. What is clear is that more metallurgical test work is required, to that a better understanding of concentrate grades (and therefore a more accurate calculation of payability for the metals) can be achieved.
Processing
The PEA assumes a plant throughput of 14.6 Mtpa and involves a process flow of primary crushing to P80 -15 cm, followed by semi autogenous (“SAG”) milling and ball milling to and grinding P80 -125 μm (coarser than optimal size indicated by testwork?), and sequential rough flotation of first lead and then zinc. The rougher flotation concentrates are first reground to an unspecified target grain size (the testwork indicated P80 minus 30-35 microns for the Pb-concentrate) and subsequently cleaned in flotation circuits to generate a Pb-Ag concentrate and a Zn concentrate.
The forecast metallurgical performance is skated over in the technical report, with summaries on pages 103 and 216 of the technical report. The concentrate grades are shown in the cash flow model of the PEA. Table 3.5.2_1 summarises the performance over the life of mine (“LOM”).
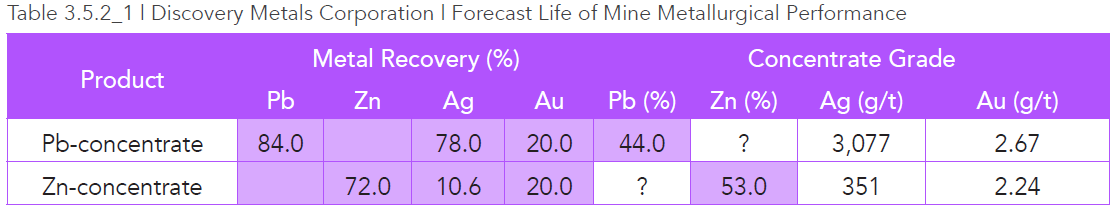
The cells highlighted light purple have the numbers provided by M3 and the other numbers are derived from these. It should be noted that the provided information is limited, not allowing to determine the content of As, Sb and Cd in the concentrate and whether penalties can be expected.
Economic Evaluation – Cordero Project
Economic Assumptions and Marketing Terms
Recent spot prices of US$1,970/oz Au, US$28.1/oz Ag, US$0.89/lb Pb and US$1.16/lb Zn were used as the base case metal prices.
The PEA uses prices which are clearly lower for gold and silver (US$1,300/oz Au and US$22/oz Ag) and not too dissimilar prices for base metals (US$0.90/lb Pb and US$1.10/lb Zn).
Table 3.6.1_1 reproduces the marketing terms assumed by M3 in the PEA which have been adopted and it should be noted that these are generally conservative. These marketing terms includes upscales/ downscales for treatment charges as function of the prevailing lead and zinc price, which have not been shown to keep the table from being even busier. The penalty terms given have also been ignored as the metallurgical plant feed and metallurgical performance provided is not sufficient to calculate the content of deleterious metals in concentrates.
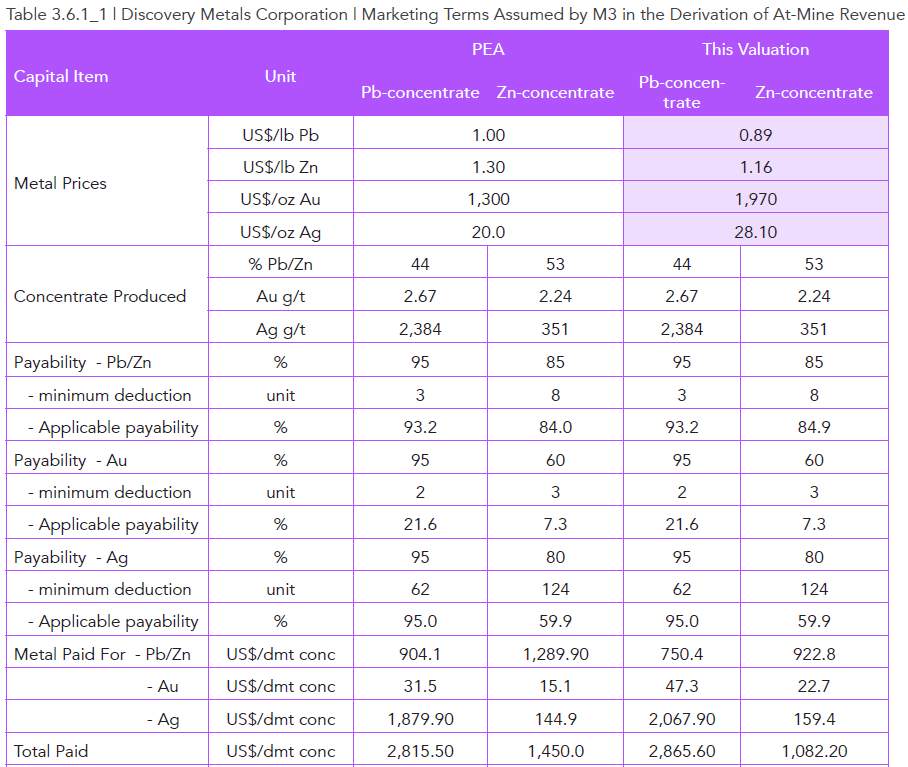
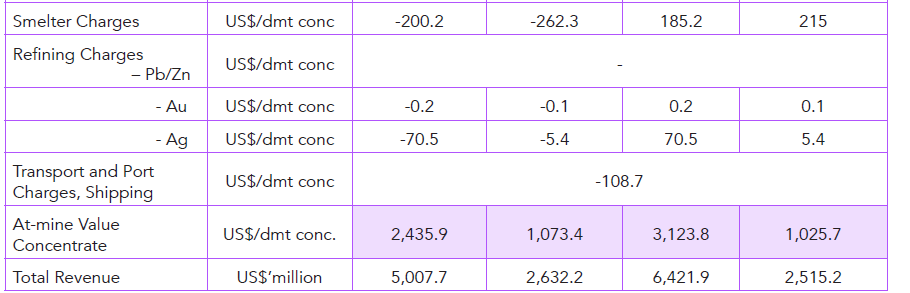
Despite large differences in the metal prices assumed for the PEA and used in this valuation the total revenue for the valuation scenario is only 17% higher than the total revenues shown in the PEA. Comparing spot prices to the PEA input prices, the higher silver prices of today substantially make up for the lower spot base metal prices.
Table 3.6.1_2 shows the relative contribution of each metal to at-mine revenue and the implication for silver equivalent grade
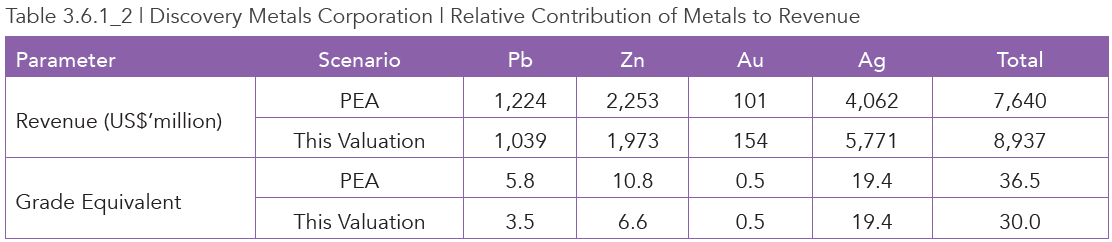
What the table above shows is that the much lower spot base metal prices means their contribution to silver equivalent grade drops making the Cordero project even more a silver project. For all intents and purposes the gold grade is immaterial despite the record spot gold price. This is because a) the feed grade is low b) only 40% of the gold is recovered in processing and c) Realisation Charges means that of the small amount of gold in concentrate, even less actually gets paid out to the client (Discovery Metals).
In summary, the Cordero project in its current format is an extremely low-grade silver project relying on silver contributing for 53.2% (PEA), or 64.6% (Crux Investor valuation), to the at-mine revenue.
Production Schedule
Due to the very long life of mine (“LOM”) the production schedule has not been put in table format as it would make it to dense to convey the essence of the forecast schedule. For this reason the most important aspects, total material mined and silver equivalent grade over the LOM, have been summarised in a diagram in Figure 3.6.2_1.
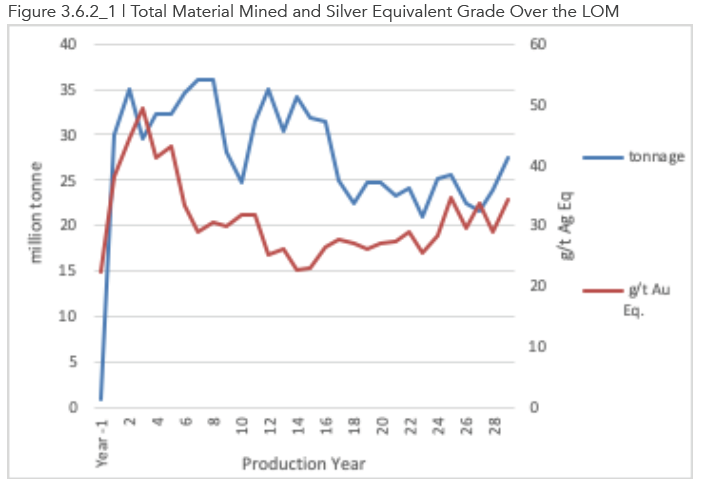
What is immediately apparent from the figure is that total mine production fluctuates considerably from year to year, which reflects the fact that this is a PEA-level study, and it has not been optimised for realistic scheduling conditions. This is not a problem per se for this stage of work, but it highlights the resource challenges. With annual throughput assumes at a constant 14.4 Mtpa, the variation is totally due to variations in waste stripping.
Also evident from the diagram is the high grading in the first 5 years
Capital Expenditure Structure
The PEA report does not provide a summary of the capital expenditure, but discusses the various items individually. Crux Investor presents the information in table format, below.
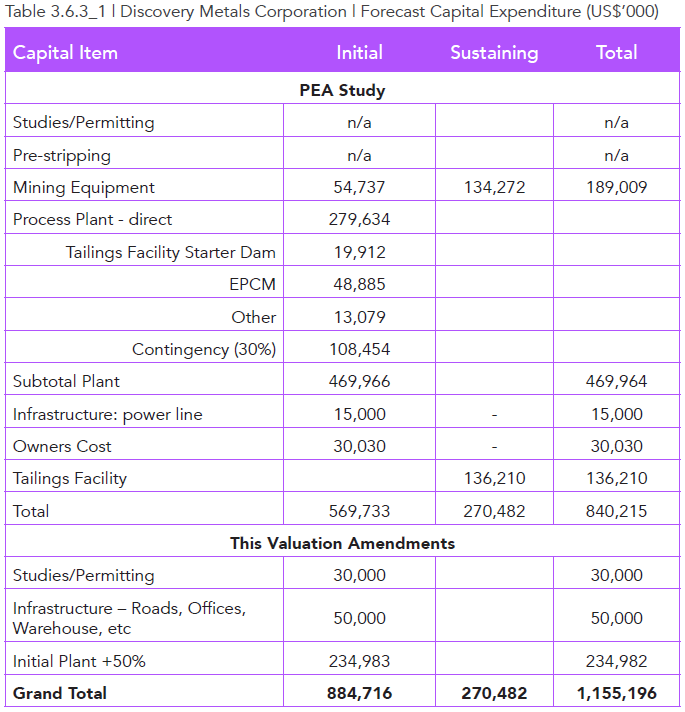
One way of looking at whether plants are in the right ball-park for their capital cost estimates is to look at the CapEx versus the throughput capacity. Here, the forecast expense of the construction of the process plant including starter tailings dam amounts to a cost of US$392/t monthly capacity. Crux Investor considers this to be far lower than conventional rates. As the process flow is not particular simple with flotation circuits for two products after rougher flotation and including a regrinding step, the plant’s capital cost will be not that different from the conventional cost rate. This valuation has added another 50% to the initial plant expense.
According to M3 connection to the national power grid at a very modest expense of US$15 million is the only infrastructure required to make the site operational. Crux Investor feels that in practice there will be a need for workshops, offices, warehouses, security, fire protection, water reticulation, electrical power distribution to the various facilities, access road and haulage road, waster rock platform construction. This valuation has added a very modest US$50 million to cover these items.
The project is still at a relative early stage and many studies will be required to come to a go-ahead decision and much permitting needed to be able to start mining. A provision of US$30 million has been included.
Even with the Crux Investor amendments, total initial and sustaining capital provisions are still relatively low for the size of operation.
Forecast Cash Operating Cost
As for the capital expenditure, suggested cost rates for operating activities look incomplete or too optimistic. Table 3.6.4_1 summarises the M3 rates and show the amendments made for this study.
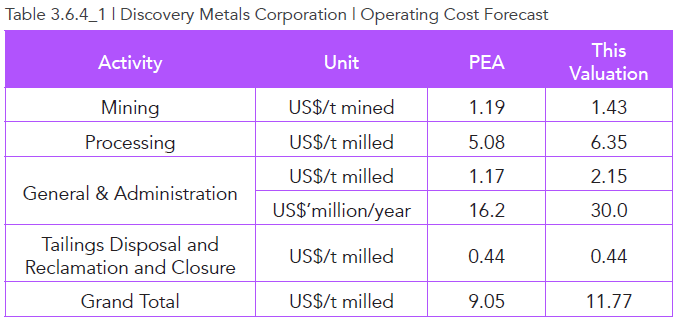
The mining costs have been provided on an annual basis with a breakdown for drilling, blasting, loading, hauling and supporting activities with escalations in hauling the predominant reason for a unit cost escalation over time. The LOM average of US$1.19/t mines is very low, even for a low-cost country like Mexico. This valuation has proportionally increased annual mining cost by 20% for a LOM rate of US$1.43/t mined. Please note the amended rate is still lower than the US$1.55/t mined used for determining the mineable inventory.
The processing cost of US$5.08/t also seems too optimistic as the mineralisation has not obvious qualities such as a very low Bond Work Index (which would help to reduce power consumption), or coarse target comminution size (which would reduce grinding steps and therefore reduce costs). This valuation has increased the cost rate by only 25% to US$6.35/t, which is probably is too optimistic and lower than the US$6.97/t treated used for determining the mineable inventory.
For the very large size operation, the assumed site G&A of US$16.2 million per annum seems too lean and has been increased to US$30 million per annum.
M3 elected to include the closure and rehabilitation activities over the LOM, which has been adopted by this valuation.
Working Capital
Being an operation that will be producing base metal concentrates, which need to be treated and refined, the product pipeline will be considerable and investments in working capital will be relatively high. Table 3.6.5_1 summarises the assumptions for the various items.
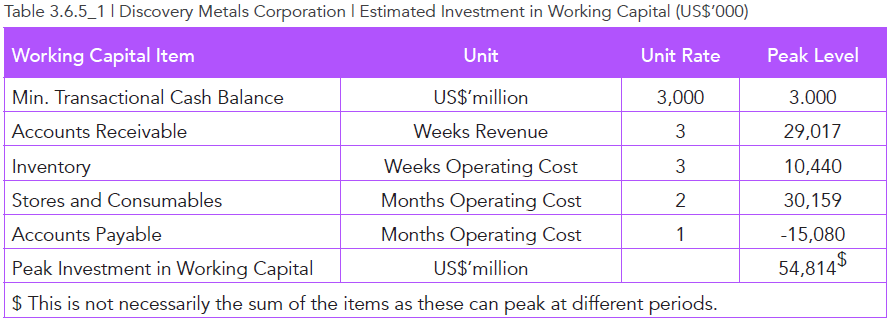
The total investment has been assumed recovered at the end of life of mine, ignoring obsolesce and pilferage.
Royalties and Taxation
The PEA is not clear about what the effective NSR royalty rate will be payable to private persons, but given the very low buy-out consideration of US$1 million for 1%-point NSR, this valuation has assumed an effective rate of 1% and ignored in the expenditure the US$1 million outlay as negligible.
The tax regulations in Mexico for mining companies include:
- An “environmental protection fee” of 0.5% on gross revenue for precious metals.
- A “Special Mining Tax” at 7.5% of the Earnings Before Interest, Taxes, Depreciation and Amortisation (EBITDA). This charge is deductible for income tax purposes.
- Amortisation of pre-production investment to a 10% rate on a straight-line basis, but allowing for accelerated depreciation when the LOM is shorter, resulting in full depreciation upon mine closure. The PEA uses a 10% rate for amortisation, but a 12.5% rate for depreciation of sustaining capital expenditure.
- The income taxes are currently 30%.
- Tax on expatriation of dividends a 10%.
Results
Table 3.6.7_1 shows the forecast financial performance over the LOM for two scenarios: PEA and this valuation inputs.
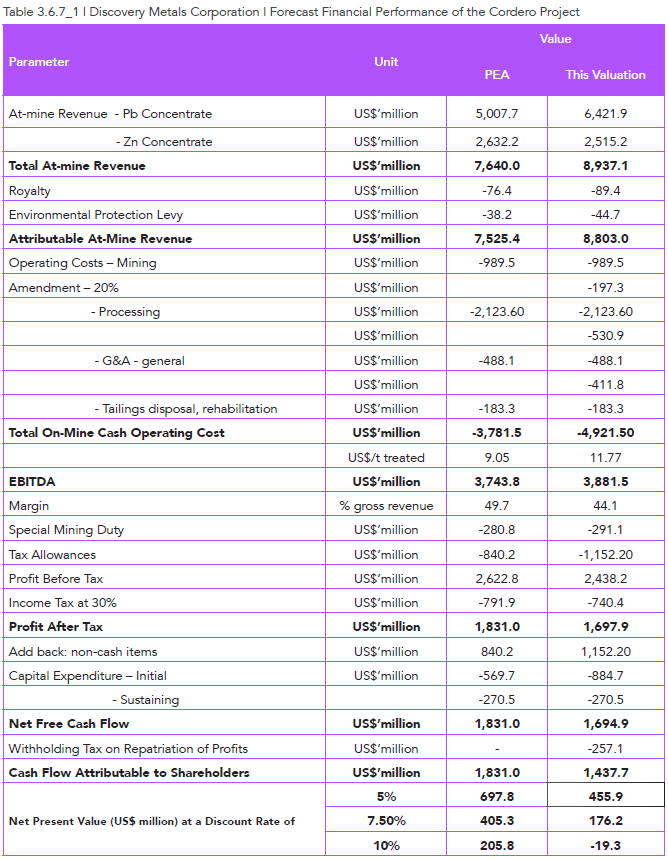
The table above indicates that for PEA assumptions the operation has a cash margin around 50%, which is usually indicative of a project that will give a decent return. M3 arrived at a NPV7.5 of US$438 million (curiously enough when discounting M3’s annual net free cash flow numbers, the result is US$407 million), which is 8% higher than the valuation generated by Crux Investor’s cash flow model.
The inputs and assumptions that Crux Investor has used for this valuation have a negative impact on the economics of the project. We are certainly not attempting to do down Discovery Metals, but we are being rigorous about the way that we look at the project. The main key areas of difference are the calculation of the Silver Equivalent grade because of Realisation Charges, and the twin adjustments of capital and operating costs.
In the Crux Investor valuation, the cash margin drops to just above 44% and net free cash flow accruing in Mexico to US$1,695 million. However should Discovery Metals repatriate the net free cashflow it must incur the 10% tax on repatriation not accounted for by the PEA, reducing the cash flow accruing in Canada to US$1,438. At 7.5% discount rate the Cordero project has a value of US$176 million.
Table 3.6.7_2 shows the sensitivity of the net present values (“NPV’s”) for various discount rates to the main input parameters.
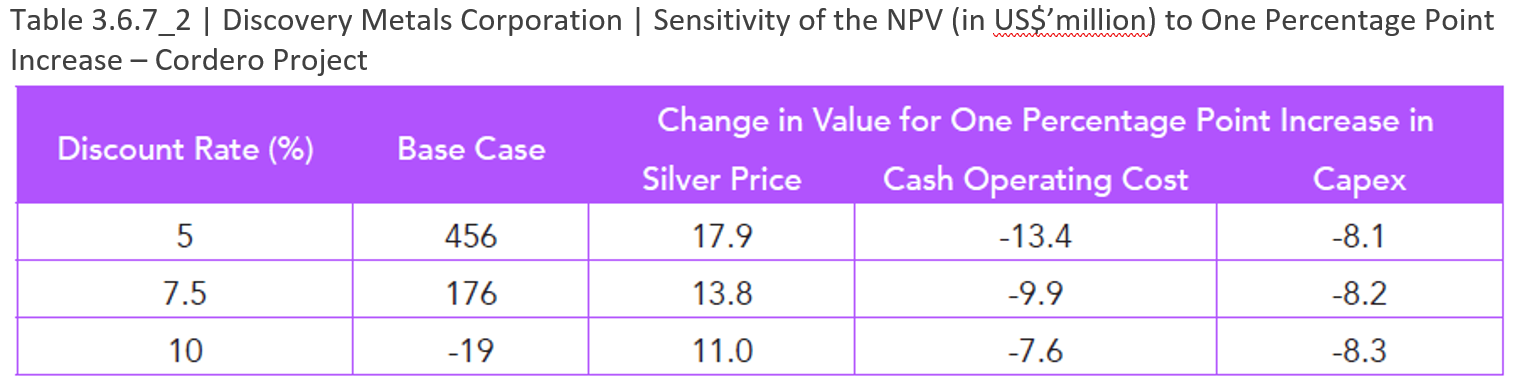
The table illustrates that a one percentage point change in the silver price (i.e. US$0.28/oz) increases the NPV7.5 by more than 7.8% (i.e. US$13.8 million). The sensitivity to changes in the cash operating cost is also apparent from the 5.6% change in NPV7.5, with a slightly lower sensitivity for capital expenditure changes.
Implications Of Drill Results After The PEA
Background
Discovery Metals started a new drilling programme late in 2019 with the first press release on drill results on 8 January stating the thesis that “within the very large resource area exists a shallow, higher-grade component that could redefine the Project entirely and vastly improve its economics.” The higher-grade component are discrete sulphide veins within disseminated mineralisation in a breccia host. According to the January 2020 press announcement “Discovery believes that definition of these veins has the potential to significantly enhance the high-grade component of the deposit.”
Figure 4.1_1 shows the drill hole plan map as at 20 July 2020 with the pink traces indicating drill holes for which results had been released pre-July 2020. It should be noted the pit outline includes two pit phases to the north and northeast not included in the PEA study as being unattractive.
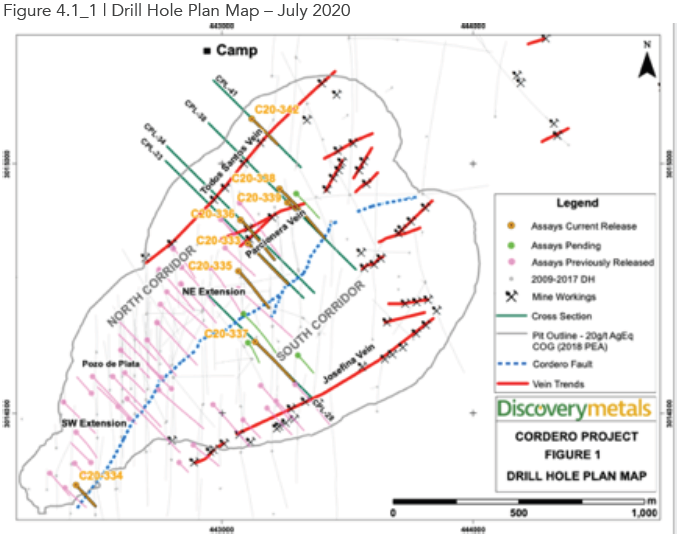
Crux Investor notes that drilling a limited number of high grade veins to sweeten the overall resource of a large tonnage bulk mining asset is challenged by mathematics. The aggregate volume of veins which have a width of, at most, 2 metres will be extremely limited. At the most optimistic aggregate strike length of 4 km, and a depth extent of 300 m with an average width of 1.5 m, the potential tonnage contribution is less than 5 Mt, or 0.8% of the tonnage of 615 Mt within the current PEA pit outline. Volumetrically tiny, the grade has to be consistently
spectacular to reach the goal of “to vastly improve the economics”. By way of example, if 0.8% of the tonnage is a high grade vein running
1 kg/t silver equivalent, it lifts the average grade from 31g/t Ag eq. to 39 g/t Ag eq. which is hardly transformative. In short, drilling out high grade veins alone does not move the needle.
There is a further challenge. Let us run, for the moment, with the idea that the high grade veins can transform the economics of a bulk mining operation. From the cross-sections provided by the Company it is evident that high-grade structures are often in contact with waste, which would result in high dilution of the vein grade if mined using large equipment, greatly diminishing the grade impact. Furthermore, it seems as if the overall grade continuity within the proposed open pit area is questionable.
For example, the drill results reported by Discovery Metals constitute less than 17% of the drill hole length and have a weighted average grade of 82 g/t Ag eq (when calculated based on payable metal in concentrate which is the method used in the PEA and the method preferred by Crux Investor). The highlighted higher-grade results in a weighted average grade of 237 g/t Ag eq. which covers 2% of the drill hole length. What these figures mean is that there does not seem to be enough mineralised material in general to make the resource hang together. Perhaps Crux Investor has got it wrong, for we only have access to public information, but from first principals it seems as if the resource will struggle to make it.
We are sure that Discovery Metals will be able to continue to pull out some high grade intersections that will be well received by the market. Ultimately, however, narrow high grade intercepts will contribute little in terms of real economic value to the Cordero project. The next section will review the announced results to further substantiate the above conclusion.
Drill Results
Table 4.2_1 gives the results of drill results announced by Discovery Metals up to 20 July 2020.
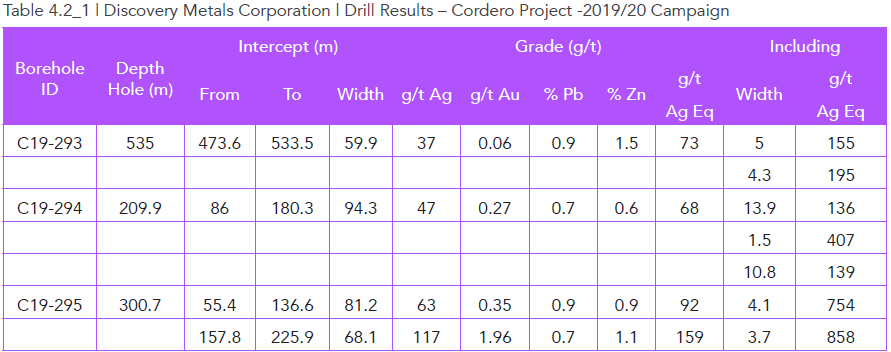
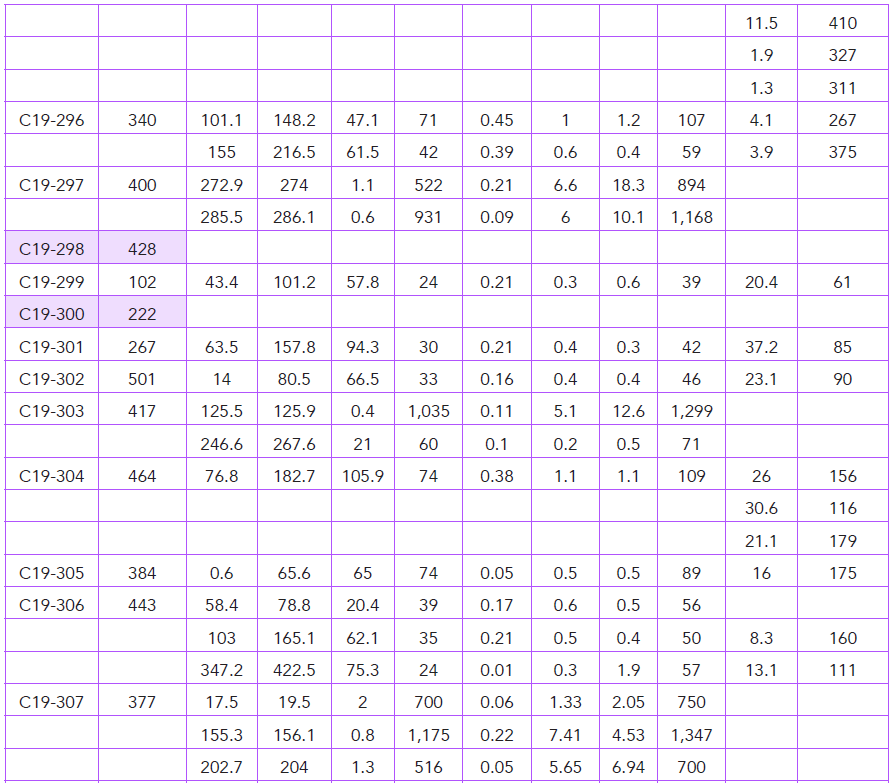
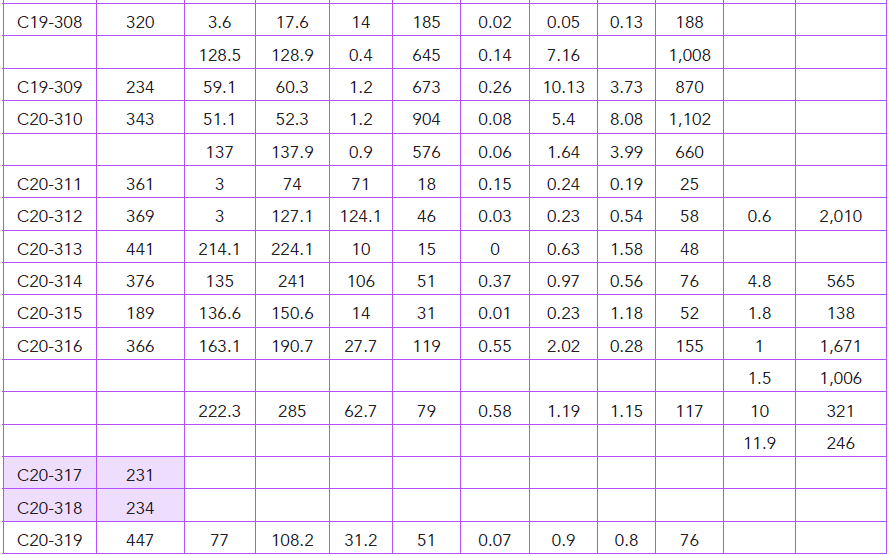
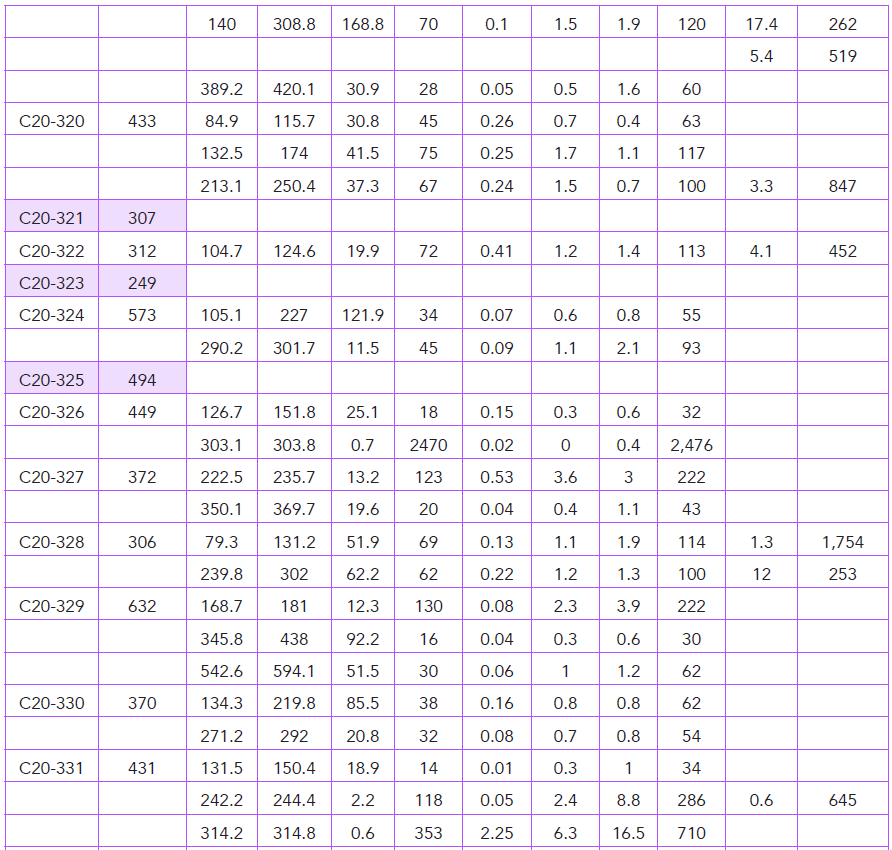
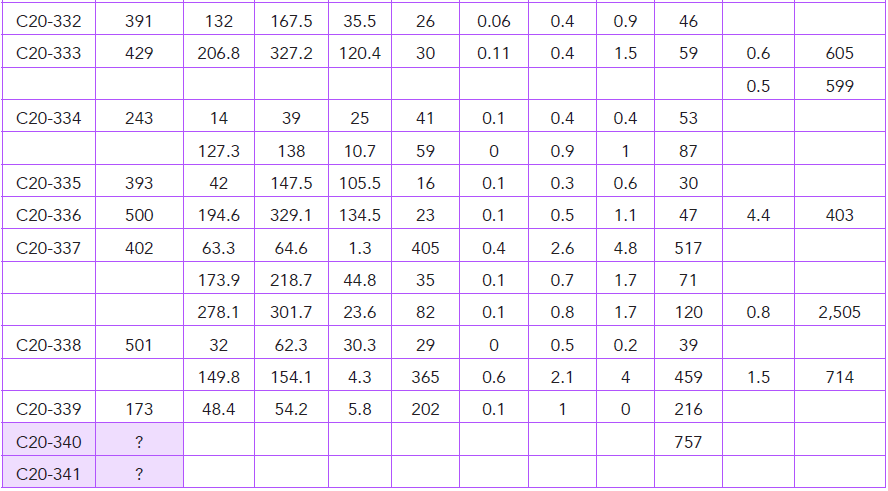
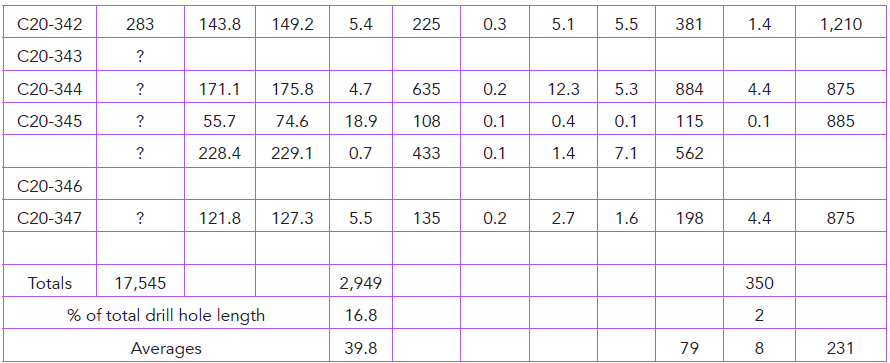
The drillholes highlighted light purple are holes for which no intercepts were reported, and can therefore be assumed to have no reportable mineralised intersections. Holes 317, 318, 321 and 323 are located in the southwestern-most bulge in the pit outline in Figure 4.1_1 with hole 334 being an exception by returning two relatively narrow intersections with grades of 55 g/t Ag Eq. and 91 g/t Ag Eq. The conversion to Ag Eq. uses the conversion factors established by Crux Investor after taking into account realisation charges. As a reminder, these conversion factors are: 13.6 for Pb, 15.4 for Zn, 7.9 for Au. [In other words, for every 1% Pb, it is being calculated as representing 13.6 g/t Ag Eq.]
Hole 300 was drilled southeast of the southwest bulge and outside of the pit outline. Unmineralised holes 298 and 325 were drilled well within the pit outline, which should be of concern.
The location of unreported / unmineralised holes 340 and 341 were never identified by Discovery Metals and their coordinates not included in their tables, which should also be of concern.
In general, there is much of concern about the drill results in aggregate once one looks beyond the headline high-grade intercepts included in the highlights section of the news releases:
- The proportion of drill hole length with reported grade is only 16.8% and has a weighted average grade of 79 g/t Ag Eq. This is too low for a bulk mineable open pit, especially when one considers that most of these holes are being drilled within an already defined mineralised envelope. The proportion of the mineralised material in a bulk mineral target should be much higher than 16.8%. Not only that but from Crux Investor eye-balling, it looks as if the project carries an implied strip ratio much higher than 1.0 of the PEA production schedule. When estimating resources using the same cut-off grade as the 20 g/t Ag Eq used for the PEA resources, much additional mineralisation will be added, but it will also dramatically reduce the average grade below 79 g/t Au Eq.
- The highlighted intercepts, with a weighted average grade of 231 g/t Ag Eq., account for only 2.0% of the drill hole length. This includes relatively wide higher-grade sections in breccia mineralisation. The metal content in these narrow, highlighted intersections account for 35% of the metal content in the wider reported intervals.
The averages of the drill results do not look promising. It should be kept in mind that these numbers assume the intersections delineate well-defined deposits and are not for isolated blocks that can only be mined accepting substantial dilution of adjacent ground, or by including internal waste, further reducing the average grade.
The next section explores this issue in greater detail.
Drill Results in Cross Sections
For this section, for the sake of brevity, a choice had to be made what drill fences would be reviewed and still give a representative picture of the results. Figure 4.3_1 contains two sections 180 m apart through the Pozo de Plata section of the pit, where mineralisation is predominantly in breccia and has historically provided the highest-grade mineral resources. These have been identified by Discovery Metals as fences CPL-17 and CPL-21 on their drill location map of the press release dated 12 February 2020.
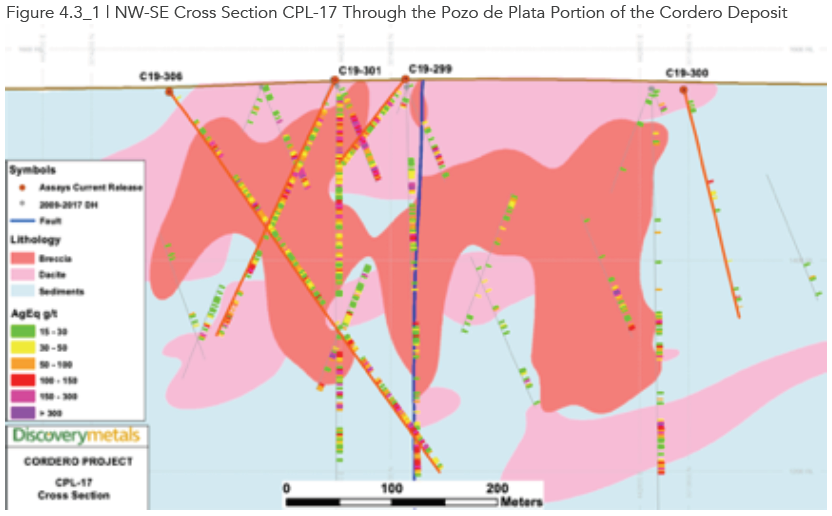
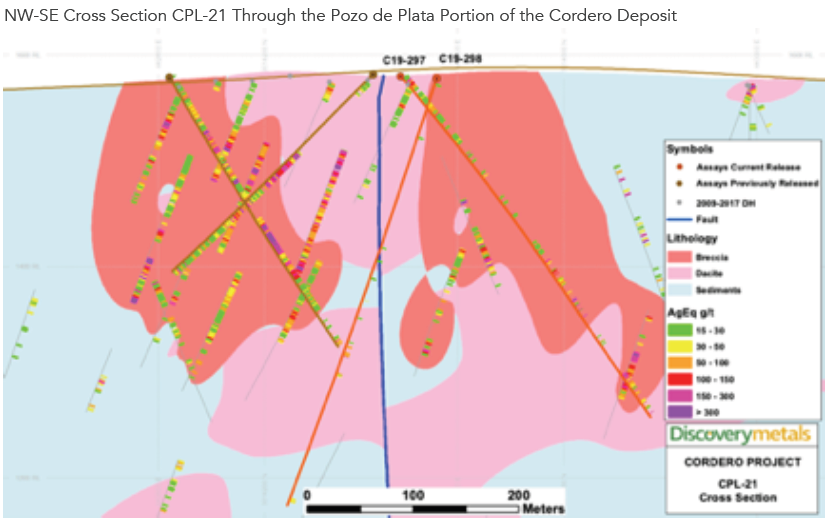
For ease of reference the drillhole results of the cross sections are repeated separately in Table 4.3_1.
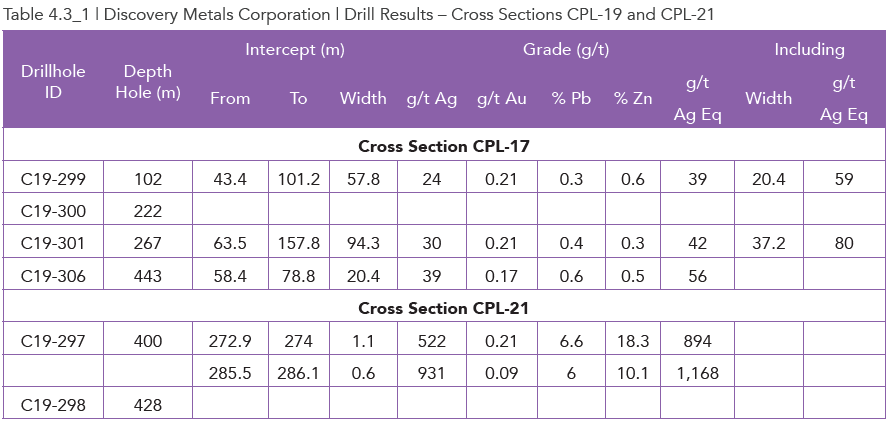
Hole-300 on CPL-17 was collared outside the pit outline and was an unmineralized hole. However the legacy drill holes further northwest also indicate poor grade intersections all the way to the fault indicated by a blue subvertical line. Shallow hole 299 had over approximately half its length a grade of 40 g/t Ag Eq. Visually hole 301 does not look bad in terms of grade colouring, but when referring to the table, it only intersected 94.3 m at 44 g/t Ag eq. over its 267 m full length with other grade intervals not deemed worthwhile by Discovery Metals to report. This hole targets the centre of the Pozo de Plata portion which is also the case for hole 306, only to be drilled in the opposite direction. For hole 306 however Discovery Metals only reported a 20.4 m interval; with 59 g/t Ag Eq. for the 443 m long hole.
Cross section CPL-21 situated 180 m to the northeast looks even less impressive with hole 298 being a dud hole, splitting the deposit in two and hole 297 targeting the portion to the southeast portion, the same that shows very poor grades in cross section CPL-17, intersecting two very narrow, very high grade intervals with 894 g/t Ag Eq and 1,168 g/t Ag Eq. Discovery Metals did not find the grade intervals for the balance of the hole worthwhile reporting.
In summary, the cross sections do not give a picture of a deposit that is consistently mineralised. There are large sections of waste between mineralised portions, which raises the question whether this is, at the end of the day, a bulk mineral target at all.
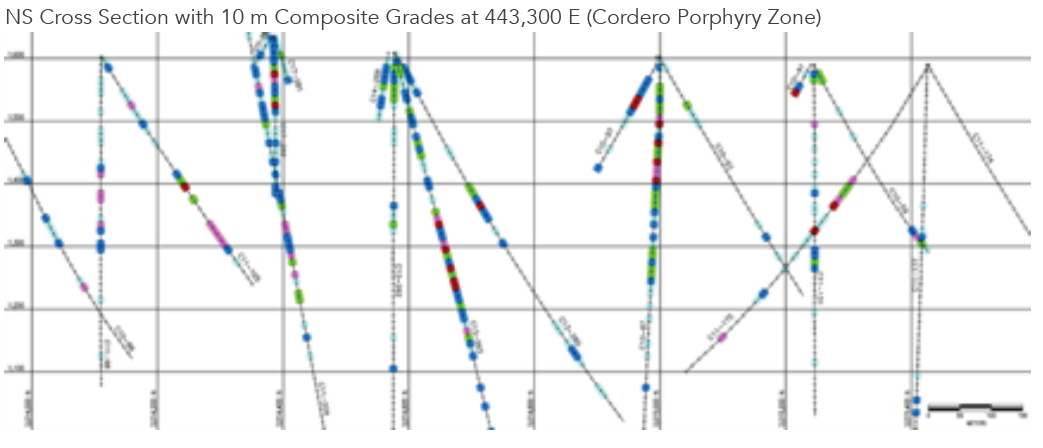
Figure 4.3_2 has cross sections 180 m northeast of the Pozo de Plata area. CPL-25 is located in the “North Corridor” on the map in Figure 4.1_1 and CPL-26 in the South Corridor, separated by a fault indicated in blue.
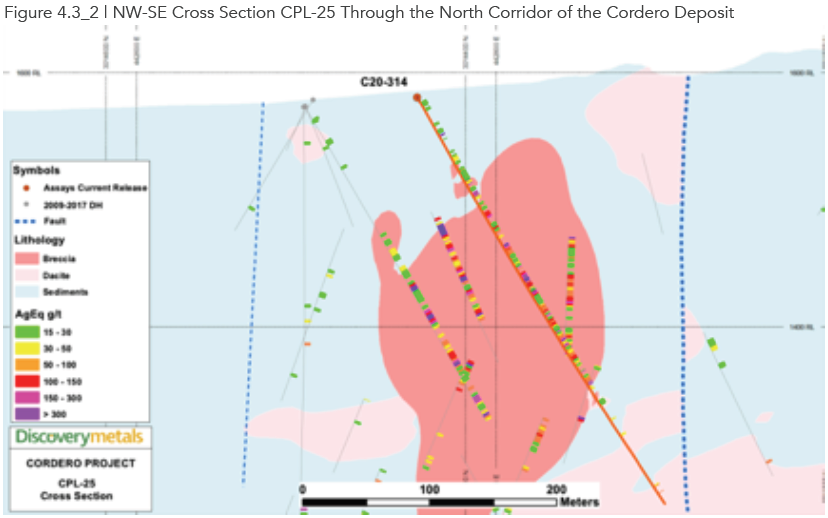
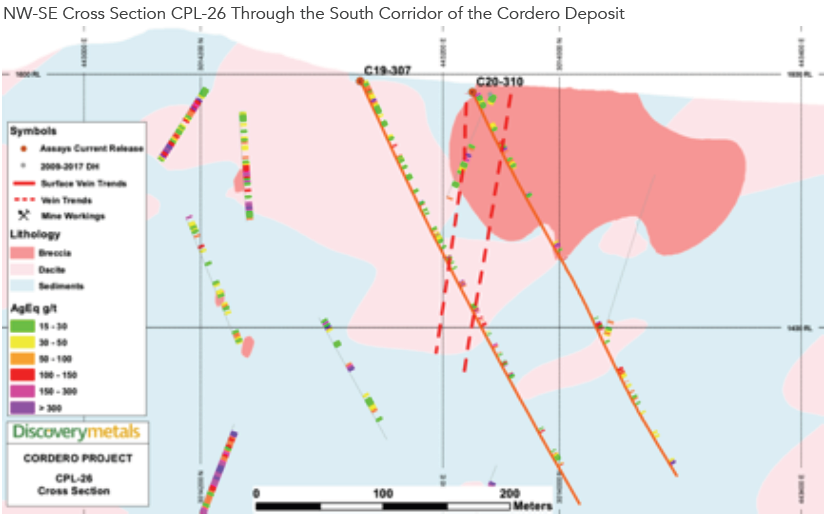
Again, for ease of reference the drillhole results of the cross sections are repeated separately in Table 4.3_2.
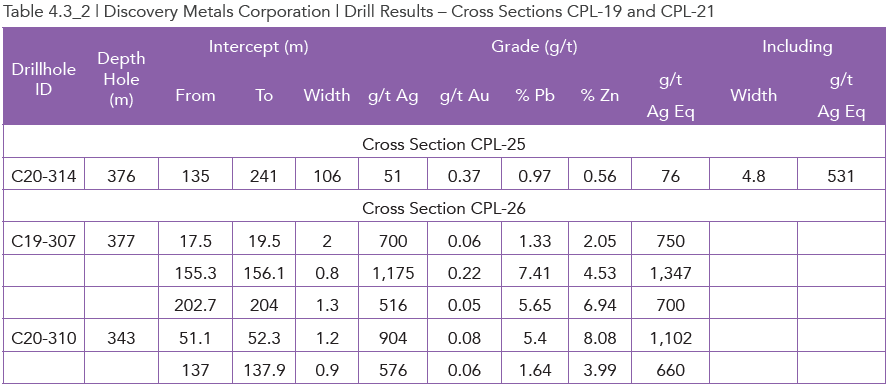
Section CPL-25 was partially chosen because it is visually one of the best cross sections with the results of hole-314 well supported by legacy holes in its vicinity. Whereas sub 30 g/t Ag Eq. (based on Discovery Metals metal grade conversion rates) are at shallower levels the company has reported an interval of 106 m from 135 m downhole depth (the first purple colour downhole in the large orange blob) of 81 g/t Ag Eq. (using Crux Investor’s metal conversion rates). Visually it is difficult to see how the PEA could have arrived at a strip rate below 1.0 considering this is one of the most promising cross sections. This impression is reinforced when reviewing cross section CPL-26 in the South Corridor. The reported intervals there are extremely short with their excellent grades quickly reduced to subeconomic levels when smeared over wider intervals.
In conclusion, it looks as if the grade of mineralisation in the North Corridor only becomes of interest at considerable depth, and the mineralisation in the South Corridor is spotty with the high vein grades not sufficiently compensating for the internal waste.
Figure 4.3_3 has at the top cross section CPL-32, which is approx. 500 m northeast of the Pozo de Plata area and at the bottom cross section CPL-38, approx. 1 km northeast of the Pozo de Plata area, both within the North Corridor.
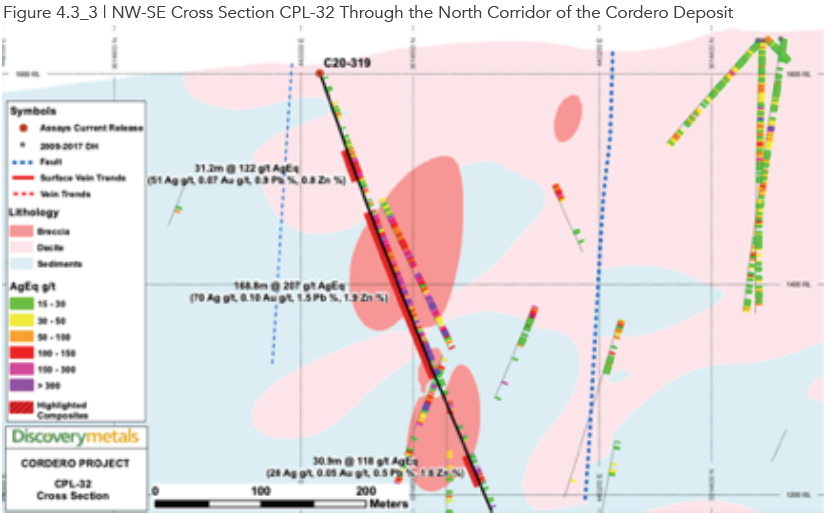
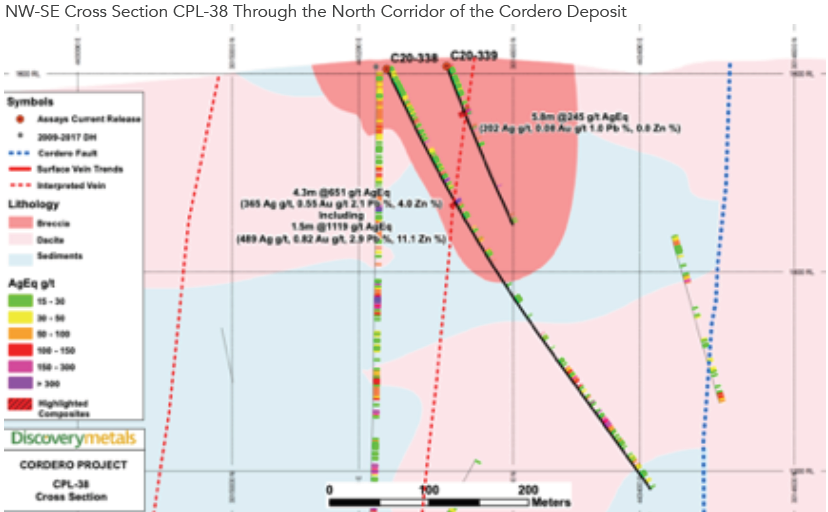
Table 4.3_3 summarises the reported results for the holes on the cross sections.
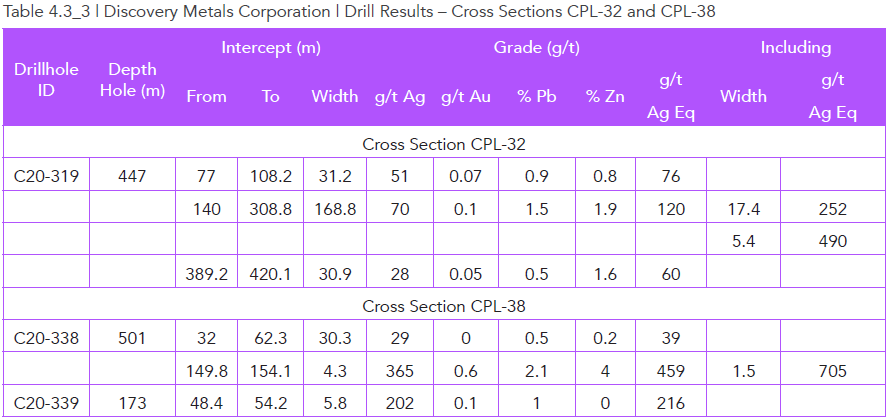
Hole 319 has some low-grade assay results until the first reported interval starting at a depth of 77 m downhole with 31.2 m of 76 g/t Ag Eq. followed by more than 30 m with low grades. The main highlighted interval of almost 169 m with 120 g/t Ag Eq is well supported by a parallel legacy hole in close proximity. Between this main interval and the deepest reported intersection is 80 m with low or no results. The deepest intersection of almost 31 m with 60 g/t Ag Eq. is not well supported by a legacy hole in close proximity.
For the two holes on cross section only short intervals are reported despite hole 338 showing (low) grade from surface. The reported 30 m with 39 g/t Ag Eq and 4.3 m with 459 g/t Ag Eq would quickly be diluted to unimpressive grades when taken over, say 100 m. It is of considerable concern that there is a lack of grade below the reported 5.8 m at 216 g/t Ag Eq. It basically severely limits the depth extent of the deposit along this section.
In summary, beyond a narrow zone defined by hole 338 and a vertical legacy hole next to this hole the deposit is poorly defined, severely limiting the size potential.
Valuation Of Discovery Metals
According to web.tmxmoney.com, there are 282.93 million shares outstanding, which at a share price of C$2.25 on 1 September 2020 would give a market capitalisation of is C$637 million, or US$ 490 million.
According to the share structure on the Discovery Metals website at 9 June 2020 there were 257 million shares outstanding. The number of issued shares therefore reflects the placement of 26.9 million units in August 2020 raising C$35 million. Each unit comes with warrants exercisable at C$1.75.
On 6 June 2020 there were 56 million warrants outstanding, all well in the money at an average price of C$0.89 and 20 million share options, also all well in the money at an average price of C$0.47.
At the end of June 2020 the net current assets amounted to C$42.17 million and had a very small lease obligation. To this must be added the C$35 milion from the August 2020 placement.
Based on the above information the Enterprise Value of Discovery Metals on a diluted basis is as derived in Table 5.1_1.
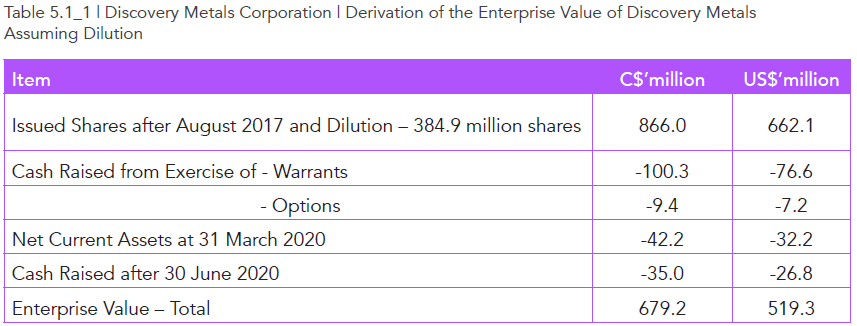
When converting the Enterprise Value to a per ounce silver equivalent basis it is US$1.99, or when using the Au/Ag ratio US$140/oz Au Eq. These are very high numbers for very low-grade resources. Based on the discussion in Section 4 there is little prospect for the grade of these resources to be materially revised upwards.
Red Flags
Discovery Metals is a well-run company with some profound technical challenges that we believe have been thoroughly aired in this Crux Investor report.
The key Red Flags are largely technical, and are listed below. What this means is that it is time for Gernot Wober put all his geological experience to the test, and to call on Lady Luck. As the legendary diamond geologist John Gurney said, ‘luck favours efficiency’.
With things as they are, and incorporating the upgrades from this 2019/20 drilling campaign, there is little prospect for the grade of the global resource base at Cordero to be materially revised upwards. There needs to be a step change in the tenor and breadth of mineralised intercepts at Cordero. And perhaps Mother Nature is not in a position to deliver on demand? From the data available thus far Crux Investor does not believe the geological endowment at Cordero is good enough to make it work.
So, if a large, bulk tonnage is not possible, then perhaps a small underground project might work? Indeed it might, but remember that the Company is running with an EV of US$354 million. Recasting the project around a high grade core will force the Company away from using banners such as “world class asset…. one of the largest development-stage silver projects in the world” which is currently the first thing that pops up in the middle of the homepage on the website. A small high-grade operation is neither world class, nor large. Nor will it command an EV of US$354 million. Cordero in Spanish means lamb. Feel free to insert your own terrifying well-known phrase or saying referencing lambs.
Who ever said finding world class assets was easy? No-one.
- The silver grade is a problem (Cordero is a either a large very low grade silver resource, or a very small high grade silver resource. It is not a large high grade silver resource)
- The payable silver equivalent grade is much lower than the stated silver equivalent grade used in news releases (Once recoveries and realization charges have been accommodated gold, lead and zinc contribute far less to the economics than headline numbers suggest)
- Drilling narrow veins are highly unlikely to markedly improve the economics of the bulk deposit as the tonnage potential is too small to make a ‘global’ difference
- Cross-sections and data provided thus far indicate that the deposit has poor potential as a bulk-mineable target
- Strip ratios are likely to exceed 1:1
- Capital Costs are probably light by 50%
- Operating costs in the PEA are well below industry standard
- The NPV of Cordero, using Crux Investor costs, is negative despite current high silver prices
Green Lights
All is not lost, however. Discovery Metals has many, many things going for it. CEO Taj Sing is driven, bright, and ambitious, and he is backed up by not only an excellent, real deal, geologist in Gernot Wober, but crucially by the Oxygen Capital group. In addition, the Company has a fabulous balance sheet, a superb shareholder register, and a significant treasury position. C$80 million in cash goes a long way, and it may, in the end, prove to be a trump card. It will be fascinating to watch what this talented management team turns to next, after Cordero.
- Enterprising management team
- Oxygen Capital are a strong backing partnership to have on board
- Excellent shareholder register and market profile
- Strong balance sheet with abundant cash and strong paper
These CRUX Reports are written for expert investors AND for people new to natural resource investing. But whether you are an expert or a newbie, we all have the same driver. We invest to make money. Sometimes investors get emotional about the investment. They actually think they own a mine. They don’t. They own shares in a company. So focus on your investment strategy, work out the best plan for your needs, stick to the fundamentals and remember that the only way you make money is if your shares go up in value… assuming you don’t forget to cash them in!
Executive Summary
Discovery Metals Corporation (“Discovery Metals”) (OTCQX:DSVMF) (TSX:DSV), is a Canadian mineral exploration and development company headquartered in Toronto, Canada, and focused on historic mining districts in Mexico. Discovery’s flagship is its 100%-owned Cordero silver project in Chihuahua State, Mexico. The 35,000-hectare property covers the announced resource and other exploration targets. The Company has a market capitalisation of C$614 million, it has recently completed a top-up capital raise and currently has over C$80 million in cash on the balance sheet. Discovery Metals is part of the Oxygen Group of companies and Eric Sprott is its largest shareholder.
Discovery Metals has a varied history, dating back to incorporation in 1986 but of most relevance was a Qualifying Transaction for listing on the TSX in April 2017. At this time the Company acquired some polymetallic Pb-Zn-Ag mineral properties in the Coahuille State of Mexico, and other holdings were later added to the portfolio by similar acquisitions. This starter portfolio contained a collection of licences grouped into three properties named Puerto Rico, Minerva and Monclova. Standard exploration (surface and underground mapping, sampling) was carried out during 2018 and into 2019, with a subsequent plan to drill Monclova after ‘promising’ results at Minerva and Monclova. In the end, this drill programme did not happen. At Puerto Rico the company reported in 2019 that it was in the final stages of a “land re-designation process” to enable drill permit applications. In the end, management focus shifted, and no major announcements have been made by Discovery Metals about the Puerto Rico re-designation status. The reason is that management focus shifted to the Cordero project.
Discovery Metals acquired Cordero through a plan of arrangement takeover of Levon Resources Limited (“Levon”) in April 2019. Cordero was the subject of a 2018 preliminary economic assessment (“PEA”) commissioned by Levon, which is now available on the Discovery Metals website and it is the main source material for this report. Since acquiring Cordero in August 2019, the Company focus has been on understanding the nature of the higher-grade zones within the larger mineralized system with the objective of upgrading the economic potential of the Project.
Looking at the Cordero numbers both Crux Investor and Discovery Metals know that the resource as it stands is too low grade to drive capital. This is why Discovery is working at improving the economics of the deposit. The PEA had a positive NPV at US$20/oz silver, but the margins are too low (an IRR of 16.5%), and the grade used in the study being too low (e.g. average grade of 32 g/t Ag eq. using a 15 g/t Ag eq. cut-off in-pit). Not only that but Crux Investor questions the capital expenditure estimates and cash operating cost provisions, as we feel the ones used in the PEA are overly optimistic. Perhaps Discovery Metals would also have arrived at different CapEx and OpCost figures if it, not Levon, had been driving the PEA? Nevertheless, Crux Investor is a great believer in benchmark analysis and when our analysis uses industry standard operating costs for Mexico, and industry standard capital expenditure figures, the economic returns at Cordero are further downgraded and the deposit is clearly rendered even more sub-economic than it was previously. Ouch.
To their credit, Discovery Metals management are highly aware of the problem, with their stated motivation for the current drilling campaign being to better define, “a shallow, higher-grade component that could redefine the Project entirely and vastly improve its economics”.
The strategy of the Company is now very clear. Discovery Metals is focusing on a high grade core to improve the economics of Cordero. And on pages 9 and 10 of the current slide deck, the plan is laid out for all to see. Slide #9: Drill to define and delineate higher grade zones; do metallurgical testwork to better define the resource by domain (which bits will behave in which way and generate which types of concentrate); both of which will lead to a new resource model in H1 2021, complete with an optimised metallurgical flowsheet as part of an optimised PEA. Slide #10: Drill 50,000–55,000m; Target bulk tonnage mineralization, aiming to find higher-grades over broad widths and to focus on filling large gaps in previous drilling; and additional targets are high-grade feeder structures and high-grade veins potential previously overlooked.
This is all well and good. We like the approach, so it gets the formal Crux Investor Green Light of approval. But, but, but, but there is a but, which is whether the asset is worth the valuation being given to it.
The share price has run so hard and so fast that the current Enterprise Value of the company is US$519 million. The PEA from 2018 demonstrates that the project in its current form is marginal despite high silver prices, which has been acknowledged by current management. The Team is now in the tricky position of having to back-fill valuation by delivering some consistent and spectacular results to transform the economics of the project. And herein lies the problem, or rather three problems.
Firstly, drilling a limited number of high grade veins to sweeten the overall resource of a large tonnage bulk mining asset is challenged by mathematics. The aggregate volume of veins which have a width of, at most, 2 metres will be extremely limited. At the most optimistic aggregate strike length of 4 km, and a depth extent of 300 m with an average width of 1.5 m, the potential tonnage contribution is less than 5 Mt, or 0.8% of the tonnage of 615 Mt within the current PEA pit outline. Volumetrically tiny, the grade has to be consistently spectacular to reach the goal of “to vastly improve the economics”. By way of example, if 0.8% of the tonnage is a high grade vein running 1kg/t silver equivalent, it lifts the average grade from 31g/t Ag eq. to 39 g/t Ag eq. which is hardly transformative. In short, drilling out high grade veins alone does not move the needle.
And that is not the only problem. Let us run, for the moment, with the idea that the high grade veins can transform the economics of a bulk mining operation, and we run into a second major problem. From the cross-sections provided by the Company it is evident that high-grade structures are often in contact with waste, which would result in high dilution of the vein grade if mined using large equipment, greatly diminishing the grade impact. Furthermore, it seems as if the overall grade continuity within the proposed open pit area is questionable. For example, the drill results reported by Discovery Metals constitute less than 17% of the drill hole length and have a weighted average grade of 79 g/t Ag eq (when calculated based on payable metal in concentrate which is the method used in the PEA and the method preferred by Crux Investor). The highlighted higher-grade results in a weighted average grade of 231 g/t Ag eq. which covers 2% of the drill hole length. What these figures mean is that there does not seem to be enough mineralised material in general to make the resource hang together. Perhaps Crux Investor has got it wrong, for we only have access to public information, but from first principals it seems as if the resource will struggle to make it.
The third major problem that Crux Investor has identified is the question of silver equivalent grades, as touched on above. When ascribing equivalent grades, Crux Investor takes pains to identify what are the payable metals in concentrates, as these numbers feed into the cash flow statement and therefore affect Net Present Value calculations. Base metal concentrates typically have to pay treatment charges, refining charges and distribution (logistics) charges on some or all of their metal streams, which together are known as Realisation Charges. For this report, and for analysing the more recent drill results, Crux has calculated silver equivalent grades using spot metal prices and either PEA-provided or industry-standard realisation charges. We note that the PEA was carried out using industry-standard realisation charges. An independent consultant signing off with responsibilities and liabilities will always report the conservative number, something which an issuer does not have to do. Companies can report a headline equivalent grade, or an equivalent grade after metallurgical recoveries. We use the equivalent grade that the company can expect to receive as reflected in dollars and cents.
We note that the recent drill results do accommodate payable metal after metallurgical recoveries but do not accommodate payable metal after Realisation Charges, which leads to a significant downgrade in the silver-equivalent grade, as the base metals and gold contributions are so small. Cordero is, absolutely, a silver project that (lives or) dies by its silver grade alone.
It is interesting to note that the charismatic and talented CEO, Taj Singh is a mining engineer, and the brains behind the technical re-evaluation of the deposit is highly respected geologist Gernot Wober. Neither of them is a metallurgist and one of the key weaknesses of the project is the metallurgical fact of realisation charges.
Putting all of this together, and then undergoing a review of cross sections with new drill results does not instil confidence in the asset. Holes in close proximity to each other have often distinctly different grades and large sections of internal waste. Rather than finding that new drill results support the resource, the more analysis that is done, the weaker the overall resource looks. Crux Investor finds it hard to follow the consultants thinking in the PEA and associated resource estimate, especially one with a prospective waste strip ratio below 1.0 and the suggested average grades. This is not a Good Thing.
It is time for Gernot Wober put all his geological experience to the test, and to call on Lady Luck. As the legendary diamond geologist John Gurney said, ‘luck favours efficiency’. With things as they are, and incorporating the upgrades from this 2019/20 drilling campaign there is little prospect for the grade of the global resource base at Cordero to be materially revised upwards. There needs to be a step change in the tenor and breadth of mineralised intercepts at Cordero.
So, if a large, bulk tonnage is not possible, then perhaps a small underground project might work? Indeed it might, but remember that the Company is running with an EV of US$519 million. Recasting the project around a high grade core will force the Company away from using banners such as “world class asset…. one of the largest development-stage silver projects in the world” which is currently the first thing that pops up in the middle of the homepage on the website. A small high-grade operation is neither world class, nor large. Nor will it command an EV of US$519 million. Cordero in Spanish means lamb. Feel free to insert your own terrifying well-known phrase or saying referencing lambs.
Who ever said finding world class assets was easy? No-one.
All is not lost, however. Discovery Metals has many, many things going for it. CEO Taj Sing is driven, bright, and ambitious, and he is backed up by not only an excellent, real deal, geologist in Gernot Wober, but crucially by the Oxygen Capital group. In addition, the Company has a fabulous balance sheet, a superb shareholder register, and stacks of cash. That C$80 million in cash goes an awfully long way, and it may, in the end, prove to be a trump card. It will be fascinating to watch what this talented management team turns to next, after roast lamb.
Introduction
Discovery Metals Corporation (“Discovery Metals”) (OTCQX:DSVMF) (TSX:DSV) is a Canadian company incorporated in 1986 which in April 2017 after a number of changes in name and business purpose became Discovery Metals focused on mineral exploration and development.
The transactions entered into in April 2017 were exploration and option agreements with two private Mexican vendors for the Puerto Rico and Renata properties in Coahuile, Mexico. These were followed in May 2017 by concluding an additional option agreement for four concessions, two of which are referred to as Minerva and Monclova.
During the financial year ending 31 December 2018 Discovery Metals carried out underground sampling at three mines on the Puerto Rico property: the eponymous Puerto Rico mine, the San Jose mine and the Zaragoza mine. At the same time a magnetic geophysical survey was completed at Monclova and mapping and channel sampling of surface outcrops at Minerva.
In August 2019 Levon Resources Limited (“Levon”) was acquired by way of a plan of arrangement for a total consideration of C$26.3 million paid for by exchanging 0.55 Discovery share for every Levon share, option and warrant. With the takeover Discovery controlled the Cordero project, a very large but low-grade silver deposit in the Chihuahua State if Mexico. Soon thereafter Discovery commenced a “Phase 1” diamond drilling programme on the property.
Also during 2019 surface mapping and sampling in addition to underground sampling was carried out at Minerva and Monclova. The company planned to drill at Monclova before the end of 2019. For Puerto Rico Discovery was in the final stages of a land re-designation process in order to be able to apply for drilling permits for the project. The Puerto Rico option agreement was amended to account for delays in obtaining the drill permits. In general the cash component of the option commitments and purchase price dropped.
Throughout the first half of 2019 the company announced results of the Phase 1 drilling at Cordero which varied from wide, low-grade intersections to very short high-grade intersections.
Figure 1_1 shows the share price performance of Discovery Metals over the last 5 years on the Toronto stock exchange (“TSX”). For the purposes of this report the period before April 2017 is immaterial.
What caused the share price to rise before April 2017 seems to be related to a reorganisation with new management installed, a capital raising and debt forgiveness. The change of business had an immediate positive impact, but for a short period after which there was a long downhill trend until mid-July 2019. The exploration results at Puerto Rico and other properties did not get traction with the market but this all changed with the Levon takeover. From the middle of last year the share price has been on an upward trajectory (complete with a coronavirus dip in March), which accelerated strongly from April of this year.
The price graph clearly indicates that Discovery Metal’s value is all about the Cordero project. And so this report will focus on Cordero and ignore the other, early-stage assets.
Historical Financial Performance
With such a short history reviewing the financial history is of little relevance. Table 2_1 summarises the financial statements since 1 September 2016.
Table 2_1 illustrates:
- The large jump in Mineral Properties balance during 2019 with the acquisition of Cordero.
- The rapid increase in cash expenditure on exploration, being between US$4 million and US$5 million in 2018 (on Puerto Rico, Monclova and Minerva) and in 2019 (the same properties and start of drilling at Cordero) to the same expenditure level in only one quarter in 2020 with the acceleration in drilling at Cordero.
- Expenditure on exploration is expensed, not capitalised.
- The expenses on corporate overheads is currently US$2 million per annum.
- The cash burn rate is approximately US$40 million per annum.
- Not evident from the table is the large additional fund raising after 30 June 2020 for a total of C$35 million before costs associated with the equity placements. The level of funding could see the company through for a long time if they choose to husband treasury in the near term.
Review Of The Cordero Project
Background
For much of the information reference was made to a NI.43- 101 compliant technical report by M3 Engineering & Technology Corporation (“M3”) in support of a preliminary economic assessment (“PEA”) of the Cordero Project, dated 18 April 2018, commissioned by Levon. Unless specifically otherwise stated all information, illustration and wording has been extracted from this report.
This section will evaluate the Cordero project on the basis of the resources considered by the PEA and the following section will determine whether the 2019/20 drilling results materially affect the value.
The Cordero project is located in the State of Chihuahua in North Central Mexico approximately 180 km south of the city of Chihuahua, and approximately 35 km northeast of the mining town of Hidalgo del Parral (Figure 3.1_1).
The project is accessed via State Highway 24 with the last 10 km dirt road.
Figure 3.1_2 shows the extent and outline of the tenement area.
The original area shown in light yellow measures approx. 20,000 hectares (“ha”) was secured by Levon in 2013 and 2014. Subsequently an additional 17,170 ha to the west and south (shown white) were staked in order to cover the prospective strike extensions of what Levon considered to be mineralised belts.
The mineral rights have largely been secured by staking contiguous lode claims that cover approximately 37,000 hectares (“ha”). Only two small inlying claims in the district are not owned by Discovery Metals. These two claims are deemed of no consequence by Discovery Metals since they are situated outside the southern fringes of the Perla prospect along the south margin of the property. The staked properties are not encumbered not royalties, but some of the original rights are, the outlines of which are shown in Figure 3.1_3.
The red shaded area is the surface projection of the 2014 mineral resource boundary illustration the 2% NSR generally applicable, some of which subject to the right of repurchase by Discovery Metals.
Geology and Mineralisation
The Cordero project covers a belt that presently consists of seven known igneous intrusive centres aligned within a northeast trend 15 km on strike and 3-5 km wide. The intrusive centres have somewhat awkwardly been named from southwest to northeast (see Figure 3.2_1):
- Moleno de Viento Caldera and Diatreme
- Dos Mil Diez Diatreme
- Pozo de Piata Diatreme
- Cordero Felsic Dome
- Cordero Porphyry Zone
- La Ceniza Stock
- Sanson Stock
Fortunately, for the purposes of this report only the names from this list that are shown in bold are the intrusives of relevance as these contain the mineral resources.
The mineralisation at Cordero is related to porphyry style intrusives which are systematically deeper toward the southwest end of the belt. In the northeast the mineralisation is visible in outcrop, whereas in the southwest the mineralisation is emplaced at a depth of a kilometre. The bottom illustration in Figure 3.2_1 is a longitudinal section through the intrusives to show this deepening trend to the southwest.
With the variations in emplacement mode for each centre the associated mineralisation differs, requiring a different exploration approach. The longitudinal section illustrates the geological setting of the 2018 mineral resources, all related to intrusive stocks that outcrop.
Mineralisation within the Cordero Resource is porphyry-style disseminated, stockwork veining sulphides within the intrusives, associated contact replacement and skarn type mineralisation (= calcareous rock altered by mineralising fluids) and discordant, through going veins (1 m - 2 m widths) with up to 500 m strike lengths. Diatremes within the resource are characterised by disseminated sulphides in mineralised breccia matrix material, stockwork veined and replaced clasts and late stockwork veins that entirely cut the mineralised diatreme breccia.
The Cordero Porphyry Zone mineralisation includes disseminated and stockwork vein, porphyry style mineralisation and diatreme breccia mineralisation, particularly in contact zones with limestone country rocks. At the Cordero Felsic Dome there is in addition to porphyry style mineralisation and stockwork veining a high-grade contact breccia with a width of 1-15 m. The Pozo de Plata Diatreme occupies an area of 1 km in diameter and is a trough-shaped body measuring 800 m x 800 m x 400 m. It contains mineralised swarms and massive sphalerite (ZnS) stockwork veins.
The minerals of economic interest are dominantly silver-bearing galena (PbS), sphalerite and pyrite (FeS2) present in roughly equal proportions. Other minerals associated with silver are stibnite (Sb2S3), tetrahedrite ({Cu,Fe,Zn,Ag}12,Sb4S13) and arsenopyrite (FeAsS). These antimony and arsenic containing minerals could spell metallurgical trouble for an operation. Deleterious elements need to be carefully evaluated through metallurgical testwork as they may incur penalty charges during downstream treatment.
Oxidation of sulphides generally is present within 2 m to 60 m of the present surface from drill hole information. Some narrow fracture zones are oxidised at depths of >600 m. Oxidation could add to metallurgical complexity.
Mineral Resources and Conversion Factors
This section may seem technical and boring, but it is crucial to understanding the value of the Cordero project. Sit tight, declutter your mind, and stick with us.
The Cordero February 2018 mineral resource estimate is based on 281 drill holes completed through September 2017 and including 18 holes drilled since the September 2014 mineral resource estimate. Figure 3.3_1 shows a map with the localities of the holes of the various drill phases for the Cordero resources area.
It is difficult to see whether a geological model was used for the estimation, or not. It appears that the resource was calculated on a low-grade equivalent threshold of 15 g/t silver equivalent, which may be appropriate when considering a ‘global’ mass of rock that is broadly anomalous. The various lithologies have distinctly different average grades, but according to M3 (the PEA resource consultants) the contacts between the lithologies could not be established as coherent shapes. Hmmm. This has the effect of dragging the resource down to the lowest common denominator of a broad silver anomaly and makes it difficult to remodel the deposit on different (lithological?) criteria.
The next key aspect of the model is the way that the Company and its consultants approached the calculation of the Conversion Factor to enable the provision of a Silver Equivalent (“Ag Eq.”) grade. Silver equivalence is a vital component of economic evaluation of a deposit like Cordero. If, on average, each tonne of ore is given a meaningful economic boost by the presence of base metals or gold, then it enhances the silver equivalent grade.
For example, if silver is trading at $25/oz and one can recover four ounces of silver from every tonne of rock, then logic suggests that the company receives $100 per tonne. Hurrah, and trebles all round. If an additional $50 per tonne is derived from other metals (Pb, Zn, Au), then $150 per tonne is received (hurrah again), and the silver equivalent grade is six ounces of silver for every tonne of rock (because the money received per tonne is six times the value of one ounce of silver, even though silver itself only contributed 2/3 of the total). When, as in the case of Cordero, the grade is not four or six ounces of silver per tonne of rock, closer to half an ounce (there are 31.1 grams in a troy ounce), then the numbers look a lot skinnier. Half an ounce of silver at $25/oz is $12.5 per tonne. Which is not a lot. At this point, the silver equivalent figure is a critical factor. Do the other metals contribute enough to give a sub-economic resource the boost to turn it into an economic resource?
First up, let us look at how Discovery Metals calculates the conversion factor, or the rationale behind their Silver Equivalent ounces. Table 3.3_1 gives the ratios to convert metal grade to Ag Eq grade and the input parameters for the conversion.
What this table shows us is that in the PEA figures, the assumed silver price is high compared to the gold price. When using the metal spot prices on 1 September of US$28.1/oz Ag, US$1,970/oz Au, US$0.89/ lb Pb and US$1.16/lb Zn the ratios to convert gold, lead and zinc would be respectively 31.7, 20.6 and 23.0, raising the importance of gold and reducing the importance of the base metals.
This is ok as far as it goes, but the real ‘Crux Investor’ moment is the realisation that these silver equivalent grades do not take into account Realisation Charges. It should not come as a surprise to industry watchers that base metal concentrates have to pay treatment charges, refining charges and distribution (logistics) charges on some or all of their metal streams. Together these accumulated costs are known as Realisation Charges, and they affect the final value of the product as much as metal-in-the-ground-adjusted-for-metallurgical-recovery.
Realisation Charges
Did you know, for example, that for a lead concentrate, the smelter will take a minimum of 3% of the lead, and approximately two ounces of silver and two grams of gold as standard from every tonne of concentrate? This means that if your concentrate is grading 4g/t Au, after 40% recovery, you then have to give away 2g/t to the smelter (50% of your gold in concentrate), which means that you end up with just 20% (40% x 50%) of the in situ gold that you started with. And that is nothing compared to what happens with zinc concentrates.
Have you ever wondered why zinc companies seem to trade on such low valuations? Well the answer is that zinc producers get rough treatment from smelters. A standard contract would see 8% of the zinc in concentrate go to the smelter, plus 3g/t of any gold, and a whopping 120g/t (~4 ounces) of any silver.
What this means is that at Cordero, the ‘payable’ contribution from gold and lead and zinc is much smaller than ‘recovered’ contribution from gold, lead, and zinc. And unfortunately it is the payable contribution from these metals that are the real world inputs into any cash flow analysis. On that basis, and for this report, and for analysing the more recent drill results, Crux has calculated silver equivalent grades using spot metal prices, PEA-provided recoveries and industry-standard Realisation Charges. As it happens the PEA was carried out using industry-standard Realisation Charges, so we have been able to use the Realisation Charges that are provided in the PEA.
Below is a table that shows these Realisation Charges and how they affect the ‘conversion factor’ that contributes to a Silver Equivalent grade.
With much of the recovered gold not paid for because of minimum deductions and the base metals incurring substantial treatment and transport charges, their relative contribution drops substantially from the amounts suggested in Table 3.3_1A. In particular gold’s contribution is affected.
Putting the Discovery Metals (DSV) and the Crux Investor Report (CIR) conversion factors side by side, you can see that Discovery Metals ascribes much greater value to the other metals than Crux does. The way that the table works is that is shows how to convert a unit of any given metal into silver equivalent grade taking into account metallurgical recovery, and realisation charges. So, for every one gram of gold shown in drill core or in assay, DSV ascribes 33.2 ‘silver equivalent’ grams per tonne, but Crux only ascribes 7.9 ‘silver equivalent’ grams per tonne, because of the punitive treatment charges for gold in lead and zinc concentrates. Similarly, for every 1% of lead in assay in samples, Discovery ascribes 36.4 ‘silver equivalent’ grams to the total, whereas Crux only ascribes 13.6 ‘silver equivalent’ grams per tonne. And so on. Zinc costs more to treat so there is less value for Discovery Metals. For every percent of zinc in concentrate, Discovery ascribes 36.1 g/t Ag Eq. whereas Crux calculates that after realisation charges, 1% of zinc in concentrate is only worth 15.4 g/t Ag Eq.
The long and the short of it, unfortunately, is that these lower conversion factors mean that Cordero gets much less support from its gold, lead and zinc contributions than the headline numbers suggest. It is not wrong for Discovery Metals to report silver equivalent grades after metallurgical recoveries only, it is just not the whole story.
We note that the recent drill results do accommodate payable metal after metallurgical recoveries but do not accommodate payable metal after Realisation Charges. When Realisation Charges are incorporated, there is a significant downgrade in the silver-equivalent grade, as the base metals and gold contributions are so small. Cordero is, absolutely, a silver project that (lives or) dies by its silver grade alone.
The next section is for those that love their geostatistics only. It may be nitty gritty and complicated, but it is revealing.
Digging into the PEA available on the Discovery Metals website, one can see on page 108 that the consultants introduce the subject of top-cuts (capping super-high grades, to facilitate resource estimation). Upon review of the assay grade statistics, the consultants applied grade caps for the key metals, which were: 1,150 g/t for silver, 6.0 g/t for gold and 16% for both lead and zinc. Following the capping of the grade and subsequent compositing to 10 m, the statistics show a drop of the coefficient of variation (“CV”, being standard deviation / mean) to 2.43 for Ag (from 4.06), 2.46 g/t for Au (from 4.11) and 2.64 for Pb (from 4.01) and 2.03 for Zn (from 2.96).
For a supposedly bulk mineable resource, these are high values for the base metals, which ideally should have CVs of below 2. It is possible that the high CV of base metals at Cordero is because the mineralisation is found in narrow, potentially discontinuous structures such as veinlets and veins that are not representative of a bulk mineable deposit like a stockwork. It raises a concern about the validity of the resource estimate, and a detailed explainer is provided below.
Crux Resources Explainer – Coefficients of Variation
The Coefficient of Variation is a measure of how closely grouped a particular data set is around its mean value. For a Gauss curve – the standard bell curve of distribution – a few examples are shown in this figure:
Looking at the curves it should be clear that when the CV is high, the standard deviation is high in relation to the mean (there is a large spread around the mean). This leads to the result that the mean is determined by values that vary significantly, both high and low, from the mean. Conversely, a low CV has a population tightly grouped around the mean. By definition, within any population values higher than the mean are compensated for by values lower than the mean.
However, when data points are limited the histogram may not be symmetrical and individual values can have a disproportional effect on the mean. The standard bell shape of distribution, The Gauss Curve, applies to the grades of rock building elements such as Na, K, Ca, Mg, etc.
For trace elements such as gold the natural distribution is skewed. Trace elements typically have a log-normal distribution with the logarithmic values having a Gauss curve shape, as per the relationship in the illustration below.
What this means is that the mean in a log normal distribution is even more determined by high values in the “tail” on the right, and being lognormal, the mean is not compensated for by low values on the left of the population. The higher the CV, the more extreme is the effect of a few high grade samples on the mean of the population. It is for this reason that the industry typically caps high grade value - to reduce the impact of a small number of ultra-high grades on the overall mean grade of a resource. When grades are subject to an appropriate top-cut, the viability of the project does not stand or fall on a few high grade values alone. In order to truly understand grade populations appropriately large data sets are required, which is why bulk sampling is such a key step in evaluating high variability resources. In the case of some deposits, the true grade will only be determined at the mine-scale, which is not necessarily the basis for a good investment. Prudence would suggest making sure that the resource stacks up even with a healthy top-cut, and not relying on the high-grades to make it a success.
When a standard top-cut renders a project sub-economic, Com¬panies tend to get creative, viz projects such as Brucejack, Aurora and Moose River that have used “clever” geostats to still include these few high value numbers by estimating methods such as Multiple Indicator Kriging. When you see that method used, take extra care.
The key point is that gold assay histograms will typically have very “positively” skewed shapes. The higher the CV, the more risky the block estimation becomes as the tail will have a larger influence on the average grade for the deposit. For ordinary kriging you would like to have a CV of 2 or lower for trace elements to have confidence in the result. This you accomplish through compositing (which averages out extreme values) and cutting high grades, the threshold of which you establish using various techniques, among others the impact on the CV for the data base.
Whereas trace elements often have very skewed distributions, base metals tend to be more normally distributed, becoming more like rock building elements. When you find base metal values with CV’s above 2 you start to get concerned about the validity of the estimation. It is possible that the high CV of base metals at Cor¬dero is because the mineralisation is found in narrow, potentially discontinuous structures such as veinlets and veins that are not representative of a bulk mineable deposit like a stockwork.
The technical report includes two cross sections, reproduced in Figure 3.3_2, illustrating the erratic nature of the composite Ag Eq. grades. The red and magenta colours indicate grades above 75 g/t Ag Eq, and simply looking at the cross-sections shows that the distribution is erratic.
Variograms run on 10 m composites for the various metals showed ranges of generally around 200 m in the horizontal and vertical directions and variable nugget levels. The omnidirectional variogram for silver has a range of 240 m. In geostatistical terms, the ‘range of the semi-variogram’ (often shortened to variogram) is a mathematical expression of how closely the grade at one point relates to the grade at another point, and the range is essentially the spatial limit of influence. For example, drill-hole data can be used help predict the silver grade of a block up to a distance of 240m away at Cordero. Running this process many times, and using different modelling techniques, and using every data point available is the art and science of resource estimation.
For grade estimation a block size of 25 m x 25 m x 10 m was chosen. M3 elected not to use ordinary kriging, but indicator kriging, which again points to complexities in estimation, never a good sign. As a reminder, the basic idea of kriging is to predict the value of a function at a given point by computing a weighted average of the known values of the function in the neighbourhood of the point. Indicator kriging is a more complicated calculation used in more complex scenarios, in an attempt to better estimate transition probabilities.
The ranges defined by the Consultants were grouped into three bands: 0-10 g/t Ag Eq., 10-50 g/t Ag Eq. and => 50 g/t Ag g/t. Indicator “pod” boundaries were defined for the three grade classes and “hard” boundaries used for the grade estimation. This means the grade outside a particular pod was not used to inform on the grade for a block in that pod. The search radii for the highest-grade pod were shortest at 70 m, 130 m for the middle range and 150 m for the lowest range, all with a 30 degree east of north orientation and 60 degree dip.
Only 2% of all the blocks were found to be in the highest-grade category class and 22% in the middle grade class.
The input parameters used for the constraining pit shells of the Cordero mineralisation to determine the potentially economical are summarised in Table 3.3_2.
From the table above, we can see that operating costs are low. Mining costs are estimated at being less than standard industry rates, and processing and G&A are also low cost. The very low assumed operating cost rates are to some extent compensated by the precious metal prices, which are distinctly lower than current spot prices.
Table 3.3_3 is the resource statement for the Cordero project, effective February 2018 at an incredibly low cut-off grade of 15 g/t Ag Eq (at current silver price equal to an in-situ value US$12.0/t).
Crux Investor actually thinks that M3 got the Ag Eq. grade calculation wrong and slightly undercooked the grades in the table above. When we run the numbers, we arrive at figures of 33.7 g/t Ag Eq, for Indicated Resources and 60.0 g/t Ag Eq. for Inferred Resources when using the conversion factors in Table 3.3_1.
Somewhat surprising in the light of the difficulty to generate a geological model and the erratic nature of the grade, the tonnage proportion classified as Inferred Resources is small at 22%.
The technical report gives the sensitivity of the resources to changes in the cut-off grade with the CEO of Discovery Metals pointing out in an interview with Crux Investor that at a cut-off grade of 50 g/t Ag Eq. there are still substantial resources of 200 million tonnes. What was not said is that more than half this tonnage is in the Inferred category, which accounts for an even higher proportion of the metal content.
Moreover, as is evident from the cross sections through the block model in Figure 3.3_3, the +50 g/t blocks (in green, red and magenta colours) are widely dispersed and not mineable as a single consistent deposit, therefore highly unlikely to be economic.
Wrapping up our conclusions on the mineral resource, Crux Investor can say that the Cordero project is a very large, but low-grade polymetallic deposit with the precious metals accounting for 41% of the recovery-adjusted-in-situ value. Unfortunately, when payable metal is considered, after realisation charges, the gold and the base metals contribute far less to the resource, rendering it a very low-grade silver resource.
Mining and Mineable Inventory
Mining of the Cordero deposit is envisaged by conventional open pit mining utilising a traditional drill, blast, load and haul sequence to deliver mill feed to the primary crusher and the waste to waste dumps located to the north and south of the proposed pits. The pit design is based on a 10 m bench height to match the resource model bench height.
The mine plan calls for the delivery of 40,000 tonnes per day (tpd) of material to the mill for a 29-year schedule and during peak production about 100,000 tpd of total material (mill feed plus waste) being mined.
Digging further into the detail Crux Investor notes that the cost assumptions used for the pit design were different to the cost assumptions used for the resource estimate. The recovery and metal price in parameters for the pit design are the same as the parameters used for the conceptual constraining pit for mineral resource estimation, but they differ substantially for cost assumptions with mining unit cost of US$1.55/t mined as base rate, US$0.008/t per 10 m bench escalator, US$6.97/t for processing and US$1.55/t G&A. This resulted in a cut-off grade of 20 g/t Ag Eq. If you refer back to Table 3.3_2, the costs were US$1.16/t mine, an escalator of US$0.005/t, US$6.41 for processing, and US$0.67/t for G&A, with a cut-off of 15 g/t Ag eq. Again, what this means is that the resource is questionable, and that cost control for the pit design are not yet nailed down.
No pit optimisation results graph is presented in the report. The mineable inventory is given in Table 3.4_1 together with the conversion ratios for tonnage and grades and metal content. There are also some aggressive numbers in these mineable inventory figures, which shows that the consultants were pushing hard to make the project work. Sadly, real life does not always work that way, and no matter how hard consultants push a project, sometimes the geology in the ground cannot be circumnavigated.
From the table above, one can see that of the precious metal in total resources more than two thirds is captured in the mineable inventory at a grade than is approximately 40-50% higher than the average grade of the deposit. This is unlikely to be explained by the increase in cut-off grade by 33% mentioned earlier in this section. Crux Investor believes that the difference must, in part, be due to a shape of the pit being used which is different to the conceptual mineral resources pit. Another alarm bell rings in the way that the inferred resources (by definition a category with lower confidence) has a higher conversion rate than the Indicated Resources
Metallurgy and Processing
Metallurgical Testwork
Testwork was carried out in 2011 on 12 composite samples from drill hole core material.
Mineralogical examination revealed galena and sphalerite to be the main economic minerals, present in highly variable grain sizes ranging from very coarse to extremely fine grained. The sphalerite contains minute inclusions of chalcopyrite (CuFeS2), which could possibly result in penalties from the smelter should the copper content exceed threshold levels.
Galena is intergrown with gangue minerals and may require additional attention to achieve the desired degree of liberation.
Comminution tests showed that the mineralised material has average hardness (Ball Bond Work index of 9.7 kWh to 15.4 kWh, averaging 12.4 kWh) and low abrasiveness (the index averaging less than 0.10) and variability typical of a large porphyry system.
Rougher flotation testwork was performed on the 12 composite samples, ground to 80% passing (P80) 74 μm, showed generally excellent recoveries of Pb (average 93.6%), less so for Zn (average 80.6%) with 84% of the silver reporting to the lead concentrate and gold split equally to the lead and zinc concentrates for an overall recovery of 40%. Of concern here is the high average head grades of lead and zinc at respectively 0.64% and 1.02% Zn compared to their grades of 0.28% and 0.47% in the mineable inventory. The composites cannot be considered representative of the planned plant feed.
Closer examination of the individual composite results showed that gold reported with the pyrite (FeS2) because the gold and iron recoveries were similar in all the samples.
Flotation tests on three composites (again not representative of the mineable resources) for different grain sizes showed a grind size coarser than 74 μm to have a detrimental impact on recovery.
Concentrates of certain composites were found to exceed penalty levels for Cd in Zn-concentrate and Sb in Pb-concentrate.
No cleaning flotation tests were carried out, which raises questions as to the metallurgical recoveries that can be expected from an industrial-scale operation. Normally there are recovery losses during the cleaning process after rougher flotation. What is clear is that more metallurgical test work is required, to that a better understanding of concentrate grades (and therefore a more accurate calculation of payability for the metals) can be achieved.
Processing
The PEA assumes a plant throughput of 14.6 Mtpa and involves a process flow of primary crushing to P80 -15 cm, followed by semi autogenous (“SAG”) milling and ball milling to and grinding P80 -125 μm (coarser than optimal size indicated by testwork?), and sequential rough flotation of first lead and then zinc. The rougher flotation concentrates are first reground to an unspecified target grain size (the testwork indicated P80 minus 30-35 microns for the Pb-concentrate) and subsequently cleaned in flotation circuits to generate a Pb-Ag concentrate and a Zn concentrate.
The forecast metallurgical performance is skated over in the technical report, with summaries on pages 103 and 216 of the technical report. The concentrate grades are shown in the cash flow model of the PEA. Table 3.5.2_1 summarises the performance over the life of mine (“LOM”).
The cells highlighted light purple have the numbers provided by M3 and the other numbers are derived from these. It should be noted that the provided information is limited, not allowing to determine the content of As, Sb and Cd in the concentrate and whether penalties can be expected.
Economic Evaluation – Cordero Project
Economic Assumptions and Marketing Terms
Recent spot prices of US$1,970/oz Au, US$28.1/oz Ag, US$0.89/lb Pb and US$1.16/lb Zn were used as the base case metal prices.
The PEA uses prices which are clearly lower for gold and silver (US$1,300/oz Au and US$22/oz Ag) and not too dissimilar prices for base metals (US$0.90/lb Pb and US$1.10/lb Zn).
Table 3.6.1_1 reproduces the marketing terms assumed by M3 in the PEA which have been adopted and it should be noted that these are generally conservative. These marketing terms includes upscales/ downscales for treatment charges as function of the prevailing lead and zinc price, which have not been shown to keep the table from being even busier. The penalty terms given have also been ignored as the metallurgical plant feed and metallurgical performance provided is not sufficient to calculate the content of deleterious metals in concentrates.
Despite large differences in the metal prices assumed for the PEA and used in this valuation the total revenue for the valuation scenario is only 17% higher than the total revenues shown in the PEA. Comparing spot prices to the PEA input prices, the higher silver prices of today substantially make up for the lower spot base metal prices.
Table 3.6.1_2 shows the relative contribution of each metal to at-mine revenue and the implication for silver equivalent grade
What the table above shows is that the much lower spot base metal prices means their contribution to silver equivalent grade drops making the Cordero project even more a silver project. For all intents and purposes the gold grade is immaterial despite the record spot gold price. This is because a) the feed grade is low b) only 40% of the gold is recovered in processing and c) Realisation Charges means that of the small amount of gold in concentrate, even less actually gets paid out to the client (Discovery Metals).
In summary, the Cordero project in its current format is an extremely low-grade silver project relying on silver contributing for 53.2% (PEA), or 64.6% (Crux Investor valuation), to the at-mine revenue.
Production Schedule
Due to the very long life of mine (“LOM”) the production schedule has not been put in table format as it would make it to dense to convey the essence of the forecast schedule. For this reason the most important aspects, total material mined and silver equivalent grade over the LOM, have been summarised in a diagram in Figure 3.6.2_1.
What is immediately apparent from the figure is that total mine production fluctuates considerably from year to year, which reflects the fact that this is a PEA-level study, and it has not been optimised for realistic scheduling conditions. This is not a problem per se for this stage of work, but it highlights the resource challenges. With annual throughput assumes at a constant 14.4 Mtpa, the variation is totally due to variations in waste stripping.
Also evident from the diagram is the high grading in the first 5 years
Capital Expenditure Structure
The PEA report does not provide a summary of the capital expenditure, but discusses the various items individually. Crux Investor presents the information in table format, below.
One way of looking at whether plants are in the right ball-park for their capital cost estimates is to look at the CapEx versus the throughput capacity. Here, the forecast expense of the construction of the process plant including starter tailings dam amounts to a cost of US$392/t monthly capacity. Crux Investor considers this to be far lower than conventional rates. As the process flow is not particular simple with flotation circuits for two products after rougher flotation and including a regrinding step, the plant’s capital cost will be not that different from the conventional cost rate. This valuation has added another 50% to the initial plant expense.
According to M3 connection to the national power grid at a very modest expense of US$15 million is the only infrastructure required to make the site operational. Crux Investor feels that in practice there will be a need for workshops, offices, warehouses, security, fire protection, water reticulation, electrical power distribution to the various facilities, access road and haulage road, waster rock platform construction. This valuation has added a very modest US$50 million to cover these items.
The project is still at a relative early stage and many studies will be required to come to a go-ahead decision and much permitting needed to be able to start mining. A provision of US$30 million has been included.
Even with the Crux Investor amendments, total initial and sustaining capital provisions are still relatively low for the size of operation.
Forecast Cash Operating Cost
As for the capital expenditure, suggested cost rates for operating activities look incomplete or too optimistic. Table 3.6.4_1 summarises the M3 rates and show the amendments made for this study.
The mining costs have been provided on an annual basis with a breakdown for drilling, blasting, loading, hauling and supporting activities with escalations in hauling the predominant reason for a unit cost escalation over time. The LOM average of US$1.19/t mines is very low, even for a low-cost country like Mexico. This valuation has proportionally increased annual mining cost by 20% for a LOM rate of US$1.43/t mined. Please note the amended rate is still lower than the US$1.55/t mined used for determining the mineable inventory.
The processing cost of US$5.08/t also seems too optimistic as the mineralisation has not obvious qualities such as a very low Bond Work Index (which would help to reduce power consumption), or coarse target comminution size (which would reduce grinding steps and therefore reduce costs). This valuation has increased the cost rate by only 25% to US$6.35/t, which is probably is too optimistic and lower than the US$6.97/t treated used for determining the mineable inventory.
For the very large size operation, the assumed site G&A of US$16.2 million per annum seems too lean and has been increased to US$30 million per annum.
M3 elected to include the closure and rehabilitation activities over the LOM, which has been adopted by this valuation.
Working Capital
Being an operation that will be producing base metal concentrates, which need to be treated and refined, the product pipeline will be considerable and investments in working capital will be relatively high. Table 3.6.5_1 summarises the assumptions for the various items.
The total investment has been assumed recovered at the end of life of mine, ignoring obsolesce and pilferage.
Royalties and Taxation
The PEA is not clear about what the effective NSR royalty rate will be payable to private persons, but given the very low buy-out consideration of US$1 million for 1%-point NSR, this valuation has assumed an effective rate of 1% and ignored in the expenditure the US$1 million outlay as negligible.
The tax regulations in Mexico for mining companies include:
- An “environmental protection fee” of 0.5% on gross revenue for precious metals.
- A “Special Mining Tax” at 7.5% of the Earnings Before Interest, Taxes, Depreciation and Amortisation (EBITDA). This charge is deductible for income tax purposes.
- Amortisation of pre-production investment to a 10% rate on a straight-line basis, but allowing for accelerated depreciation when the LOM is shorter, resulting in full depreciation upon mine closure. The PEA uses a 10% rate for amortisation, but a 12.5% rate for depreciation of sustaining capital expenditure.
- The income taxes are currently 30%.
- Tax on expatriation of dividends a 10%.
Results
Table 3.6.7_1 shows the forecast financial performance over the LOM for two scenarios: PEA and this valuation inputs.
The table above indicates that for PEA assumptions the operation has a cash margin around 50%, which is usually indicative of a project that will give a decent return. M3 arrived at a NPV7.5 of US$438 million (curiously enough when discounting M3’s annual net free cash flow numbers, the result is US$407 million), which is 8% higher than the valuation generated by Crux Investor’s cash flow model.
The inputs and assumptions that Crux Investor has used for this valuation have a negative impact on the economics of the project. We are certainly not attempting to do down Discovery Metals, but we are being rigorous about the way that we look at the project. The main key areas of difference are the calculation of the Silver Equivalent grade because of Realisation Charges, and the twin adjustments of capital and operating costs.
In the Crux Investor valuation, the cash margin drops to just above 44% and net free cash flow accruing in Mexico to US$1,695 million. However should Discovery Metals repatriate the net free cashflow it must incur the 10% tax on repatriation not accounted for by the PEA, reducing the cash flow accruing in Canada to US$1,438. At 7.5% discount rate the Cordero project has a value of US$176 million.
Table 3.6.7_2 shows the sensitivity of the net present values (“NPV’s”) for various discount rates to the main input parameters.
The table illustrates that a one percentage point change in the silver price (i.e. US$0.28/oz) increases the NPV7.5 by more than 7.8% (i.e. US$13.8 million). The sensitivity to changes in the cash operating cost is also apparent from the 5.6% change in NPV7.5, with a slightly lower sensitivity for capital expenditure changes.
Implications Of Drill Results After The PEA
Background
Discovery Metals started a new drilling programme late in 2019 with the first press release on drill results on 8 January stating the thesis that “within the very large resource area exists a shallow, higher-grade component that could redefine the Project entirely and vastly improve its economics.” The higher-grade component are discrete sulphide veins within disseminated mineralisation in a breccia host. According to the January 2020 press announcement “Discovery believes that definition of these veins has the potential to significantly enhance the high-grade component of the deposit.”
Figure 4.1_1 shows the drill hole plan map as at 20 July 2020 with the pink traces indicating drill holes for which results had been released pre-July 2020. It should be noted the pit outline includes two pit phases to the north and northeast not included in the PEA study as being unattractive.
Crux Investor notes that drilling a limited number of high grade veins to sweeten the overall resource of a large tonnage bulk mining asset is challenged by mathematics. The aggregate volume of veins which have a width of, at most, 2 metres will be extremely limited. At the most optimistic aggregate strike length of 4 km, and a depth extent of 300 m with an average width of 1.5 m, the potential tonnage contribution is less than 5 Mt, or 0.8% of the tonnage of 615 Mt within the current PEA pit outline. Volumetrically tiny, the grade has to be consistently
spectacular to reach the goal of “to vastly improve the economics”. By way of example, if 0.8% of the tonnage is a high grade vein running
1 kg/t silver equivalent, it lifts the average grade from 31g/t Ag eq. to 39 g/t Ag eq. which is hardly transformative. In short, drilling out high grade veins alone does not move the needle.
There is a further challenge. Let us run, for the moment, with the idea that the high grade veins can transform the economics of a bulk mining operation. From the cross-sections provided by the Company it is evident that high-grade structures are often in contact with waste, which would result in high dilution of the vein grade if mined using large equipment, greatly diminishing the grade impact. Furthermore, it seems as if the overall grade continuity within the proposed open pit area is questionable.
For example, the drill results reported by Discovery Metals constitute less than 17% of the drill hole length and have a weighted average grade of 82 g/t Ag eq (when calculated based on payable metal in concentrate which is the method used in the PEA and the method preferred by Crux Investor). The highlighted higher-grade results in a weighted average grade of 237 g/t Ag eq. which covers 2% of the drill hole length. What these figures mean is that there does not seem to be enough mineralised material in general to make the resource hang together. Perhaps Crux Investor has got it wrong, for we only have access to public information, but from first principals it seems as if the resource will struggle to make it.
We are sure that Discovery Metals will be able to continue to pull out some high grade intersections that will be well received by the market. Ultimately, however, narrow high grade intercepts will contribute little in terms of real economic value to the Cordero project. The next section will review the announced results to further substantiate the above conclusion.
Drill Results
Table 4.2_1 gives the results of drill results announced by Discovery Metals up to 20 July 2020.
The drillholes highlighted light purple are holes for which no intercepts were reported, and can therefore be assumed to have no reportable mineralised intersections. Holes 317, 318, 321 and 323 are located in the southwestern-most bulge in the pit outline in Figure 4.1_1 with hole 334 being an exception by returning two relatively narrow intersections with grades of 55 g/t Ag Eq. and 91 g/t Ag Eq. The conversion to Ag Eq. uses the conversion factors established by Crux Investor after taking into account realisation charges. As a reminder, these conversion factors are: 13.6 for Pb, 15.4 for Zn, 7.9 for Au. [In other words, for every 1% Pb, it is being calculated as representing 13.6 g/t Ag Eq.]
Hole 300 was drilled southeast of the southwest bulge and outside of the pit outline. Unmineralised holes 298 and 325 were drilled well within the pit outline, which should be of concern.
The location of unreported / unmineralised holes 340 and 341 were never identified by Discovery Metals and their coordinates not included in their tables, which should also be of concern.
In general, there is much of concern about the drill results in aggregate once one looks beyond the headline high-grade intercepts included in the highlights section of the news releases:
- The proportion of drill hole length with reported grade is only 16.8% and has a weighted average grade of 79 g/t Ag Eq. This is too low for a bulk mineable open pit, especially when one considers that most of these holes are being drilled within an already defined mineralised envelope. The proportion of the mineralised material in a bulk mineral target should be much higher than 16.8%. Not only that but from Crux Investor eye-balling, it looks as if the project carries an implied strip ratio much higher than 1.0 of the PEA production schedule. When estimating resources using the same cut-off grade as the 20 g/t Ag Eq used for the PEA resources, much additional mineralisation will be added, but it will also dramatically reduce the average grade below 79 g/t Au Eq.
- The highlighted intercepts, with a weighted average grade of 231 g/t Ag Eq., account for only 2.0% of the drill hole length. This includes relatively wide higher-grade sections in breccia mineralisation. The metal content in these narrow, highlighted intersections account for 35% of the metal content in the wider reported intervals.
The averages of the drill results do not look promising. It should be kept in mind that these numbers assume the intersections delineate well-defined deposits and are not for isolated blocks that can only be mined accepting substantial dilution of adjacent ground, or by including internal waste, further reducing the average grade.
The next section explores this issue in greater detail.
Drill Results in Cross Sections
For this section, for the sake of brevity, a choice had to be made what drill fences would be reviewed and still give a representative picture of the results. Figure 4.3_1 contains two sections 180 m apart through the Pozo de Plata section of the pit, where mineralisation is predominantly in breccia and has historically provided the highest-grade mineral resources. These have been identified by Discovery Metals as fences CPL-17 and CPL-21 on their drill location map of the press release dated 12 February 2020.
For ease of reference the drillhole results of the cross sections are repeated separately in Table 4.3_1.
Hole-300 on CPL-17 was collared outside the pit outline and was an unmineralized hole. However the legacy drill holes further northwest also indicate poor grade intersections all the way to the fault indicated by a blue subvertical line. Shallow hole 299 had over approximately half its length a grade of 40 g/t Ag Eq. Visually hole 301 does not look bad in terms of grade colouring, but when referring to the table, it only intersected 94.3 m at 44 g/t Ag eq. over its 267 m full length with other grade intervals not deemed worthwhile by Discovery Metals to report. This hole targets the centre of the Pozo de Plata portion which is also the case for hole 306, only to be drilled in the opposite direction. For hole 306 however Discovery Metals only reported a 20.4 m interval; with 59 g/t Ag Eq. for the 443 m long hole.
Cross section CPL-21 situated 180 m to the northeast looks even less impressive with hole 298 being a dud hole, splitting the deposit in two and hole 297 targeting the portion to the southeast portion, the same that shows very poor grades in cross section CPL-17, intersecting two very narrow, very high grade intervals with 894 g/t Ag Eq and 1,168 g/t Ag Eq. Discovery Metals did not find the grade intervals for the balance of the hole worthwhile reporting.
In summary, the cross sections do not give a picture of a deposit that is consistently mineralised. There are large sections of waste between mineralised portions, which raises the question whether this is, at the end of the day, a bulk mineral target at all.
Figure 4.3_2 has cross sections 180 m northeast of the Pozo de Plata area. CPL-25 is located in the “North Corridor” on the map in Figure 4.1_1 and CPL-26 in the South Corridor, separated by a fault indicated in blue.
Again, for ease of reference the drillhole results of the cross sections are repeated separately in Table 4.3_2.
Section CPL-25 was partially chosen because it is visually one of the best cross sections with the results of hole-314 well supported by legacy holes in its vicinity. Whereas sub 30 g/t Ag Eq. (based on Discovery Metals metal grade conversion rates) are at shallower levels the company has reported an interval of 106 m from 135 m downhole depth (the first purple colour downhole in the large orange blob) of 81 g/t Ag Eq. (using Crux Investor’s metal conversion rates). Visually it is difficult to see how the PEA could have arrived at a strip rate below 1.0 considering this is one of the most promising cross sections. This impression is reinforced when reviewing cross section CPL-26 in the South Corridor. The reported intervals there are extremely short with their excellent grades quickly reduced to subeconomic levels when smeared over wider intervals.
In conclusion, it looks as if the grade of mineralisation in the North Corridor only becomes of interest at considerable depth, and the mineralisation in the South Corridor is spotty with the high vein grades not sufficiently compensating for the internal waste.
Figure 4.3_3 has at the top cross section CPL-32, which is approx. 500 m northeast of the Pozo de Plata area and at the bottom cross section CPL-38, approx. 1 km northeast of the Pozo de Plata area, both within the North Corridor.
Table 4.3_3 summarises the reported results for the holes on the cross sections.
Hole 319 has some low-grade assay results until the first reported interval starting at a depth of 77 m downhole with 31.2 m of 76 g/t Ag Eq. followed by more than 30 m with low grades. The main highlighted interval of almost 169 m with 120 g/t Ag Eq is well supported by a parallel legacy hole in close proximity. Between this main interval and the deepest reported intersection is 80 m with low or no results. The deepest intersection of almost 31 m with 60 g/t Ag Eq. is not well supported by a legacy hole in close proximity.
For the two holes on cross section only short intervals are reported despite hole 338 showing (low) grade from surface. The reported 30 m with 39 g/t Ag Eq and 4.3 m with 459 g/t Ag Eq would quickly be diluted to unimpressive grades when taken over, say 100 m. It is of considerable concern that there is a lack of grade below the reported 5.8 m at 216 g/t Ag Eq. It basically severely limits the depth extent of the deposit along this section.
In summary, beyond a narrow zone defined by hole 338 and a vertical legacy hole next to this hole the deposit is poorly defined, severely limiting the size potential.
Valuation Of Discovery Metals
According to web.tmxmoney.com, there are 282.93 million shares outstanding, which at a share price of C$2.25 on 1 September 2020 would give a market capitalisation of is C$637 million, or US$ 490 million.
According to the share structure on the Discovery Metals website at 9 June 2020 there were 257 million shares outstanding. The number of issued shares therefore reflects the placement of 26.9 million units in August 2020 raising C$35 million. Each unit comes with warrants exercisable at C$1.75.
On 6 June 2020 there were 56 million warrants outstanding, all well in the money at an average price of C$0.89 and 20 million share options, also all well in the money at an average price of C$0.47.
At the end of June 2020 the net current assets amounted to C$42.17 million and had a very small lease obligation. To this must be added the C$35 milion from the August 2020 placement.
Based on the above information the Enterprise Value of Discovery Metals on a diluted basis is as derived in Table 5.1_1.
When converting the Enterprise Value to a per ounce silver equivalent basis it is US$1.99, or when using the Au/Ag ratio US$140/oz Au Eq. These are very high numbers for very low-grade resources. Based on the discussion in Section 4 there is little prospect for the grade of these resources to be materially revised upwards.
Red Flags
Discovery Metals is a well-run company with some profound technical challenges that we believe have been thoroughly aired in this Crux Investor report.
The key Red Flags are largely technical, and are listed below. What this means is that it is time for Gernot Wober put all his geological experience to the test, and to call on Lady Luck. As the legendary diamond geologist John Gurney said, ‘luck favours efficiency’.
With things as they are, and incorporating the upgrades from this 2019/20 drilling campaign, there is little prospect for the grade of the global resource base at Cordero to be materially revised upwards. There needs to be a step change in the tenor and breadth of mineralised intercepts at Cordero. And perhaps Mother Nature is not in a position to deliver on demand? From the data available thus far Crux Investor does not believe the geological endowment at Cordero is good enough to make it work.
So, if a large, bulk tonnage is not possible, then perhaps a small underground project might work? Indeed it might, but remember that the Company is running with an EV of US$354 million. Recasting the project around a high grade core will force the Company away from using banners such as “world class asset…. one of the largest development-stage silver projects in the world” which is currently the first thing that pops up in the middle of the homepage on the website. A small high-grade operation is neither world class, nor large. Nor will it command an EV of US$354 million. Cordero in Spanish means lamb. Feel free to insert your own terrifying well-known phrase or saying referencing lambs.
Who ever said finding world class assets was easy? No-one.
- The silver grade is a problem (Cordero is a either a large very low grade silver resource, or a very small high grade silver resource. It is not a large high grade silver resource)
- The payable silver equivalent grade is much lower than the stated silver equivalent grade used in news releases (Once recoveries and realization charges have been accommodated gold, lead and zinc contribute far less to the economics than headline numbers suggest)
- Drilling narrow veins are highly unlikely to markedly improve the economics of the bulk deposit as the tonnage potential is too small to make a ‘global’ difference
- Cross-sections and data provided thus far indicate that the deposit has poor potential as a bulk-mineable target
- Strip ratios are likely to exceed 1:1
- Capital Costs are probably light by 50%
- Operating costs in the PEA are well below industry standard
- The NPV of Cordero, using Crux Investor costs, is negative despite current high silver prices
Green Lights
All is not lost, however. Discovery Metals has many, many things going for it. CEO Taj Sing is driven, bright, and ambitious, and he is backed up by not only an excellent, real deal, geologist in Gernot Wober, but crucially by the Oxygen Capital group. In addition, the Company has a fabulous balance sheet, a superb shareholder register, and a significant treasury position. C$80 million in cash goes a long way, and it may, in the end, prove to be a trump card. It will be fascinating to watch what this talented management team turns to next, after Cordero.
- Enterprising management team
- Oxygen Capital are a strong backing partnership to have on board
- Excellent shareholder register and market profile
- Strong balance sheet with abundant cash and strong paper
These CRUX Reports are written for expert investors AND for people new to natural resource investing. But whether you are an expert or a newbie, we all have the same driver. We invest to make money. Sometimes investors get emotional about the investment. They actually think they own a mine. They don’t. They own shares in a company. So focus on your investment strategy, work out the best plan for your needs, stick to the fundamentals and remember that the only way you make money is if your shares go up in value… assuming you don’t forget to cash them in!
To read the FULL report, for FREE, please subscribe below.
- Notification By Email When Our Latest Notes Are Published With Immediate Access As Soon As They Go "Live"
- Suggest Future Companies To Be Analysed (Launching Soon)
- Additional Related Notes and "How To's" To Aid You On Your Investment Journey.
Already a subscriber? Sign in