Executive Summary
Gold Resource Corporation (“GORO”) (NYSE:GORO) is a US gold mining company with an operating mine in the Oaxaca state of Mexico, producing base metal concentrates (copper, lead and zinc) with precious metal credits and precious metals in doré, and a new heap leach operation in Nevada, USA, which produces gold and silver in doré.
The company explored and developed the Aquila project in Mexico between 2006 and 2010, successfully bringing the Arista mine into production and generating so much cash that it could more than reimburse the equity capital raised in 2010 within two years of production start. The reserves declared at 31 December 2019 give the mine life until mid-2024, which is quite short. Having said that, the well-established track record of successful annual reserve replenishment means that it is reasonable to expect mine life to extend to 2029, and possibly even further. The heap leach operation in Nevada, Isabella Pearl, although new, has a mine life of less than three years. Exploration around Isabella Pearl has the explicit aim to add resources and therefore to extend mine-life.
The management, like so many resource teams, did not give the Company a proper name, instead choosing to concatenate a bunch of labels – in this case, ‘gold’ and ‘resource’ and ‘corporation’. At the beginning the label seemed to fit, but over time, however, the precious metals grade dropped. From 2014 onwards base metal grades, probably reflecting metal zonation in the deposits, steadily increased. The contribution of base metals to financial performance grew from 2014 onwards, assisted by relative commodity price moves, until base metals were the dominant revenue source in 2018. By this time the company’s moniker had become a misnomer, once again highlighting the difference between a real company name and a set of labels masquerading as a name.
In 2015 management started acquiring precious metal assets in Nevada, USA, starting with an option agreement, followed in 2016 by outright purchases. Fortunately, management has a value-focused policy, dismissing the concept of growth for growth’s sake and not overpaying for acquisitions. The most advanced rights bought were of claims covering the Isabella Pearl deposits which had defined mineral resources of 0.19 million ounces (“Moz”) at a high grade and amenable to cheap heap leaching with excellent metallurgical recoveries. In this light the consideration paid, equivalent to US$60/oz, was cheap. At a planned production rate of more than 40,000 ounces per annum, GORO would again become a predominantly precious metal producer.
Management takes great pride in having consistently paid dividends on a monthly basis since start of production at Arista. Crux Investor, however, feels that blindly sticking to a dividend policy has not always benefited shareholders. Indeed, the increase in base metal revenue from the Aquila project could not compensate for the loss of precious metal revenue from the same mine, and remember that both base and precious metal prices were in decline from 2011 to 2016. Cash flow from operations net of investments became negative to marginal in the period 2015 to 2017, and yet the dividend policy was maintained. From a peak of US$39.9 M in 2012 total dividends in the period 2017-2019 averaged only US$1.3 M per annum. Keeping paying even these small dividends in 2018 and 2019 was an artificial exercise as the equity capital raised in these years far exceeded dividends. It was a matter of taking with one hand to give with the other.
The equity raises were needed for a period of high capital investment from 2017 to 2019 to fund the development of the Isabella Pearl mine, which reached commercial production in October 2019. All things being equal apart from the rising gold price, the new mine should have resulted in a major improvement in cash generation, but then the virus struck. Production in Mexico was severely impacted by the government ordering a nearly 8-week long shutdown. Whereas in the USA gold production in Q3 2020 was almost 90% of the production in the first six months, production for the year to date was a very modest 16,747 oz Au, far below the steady state target of 40,000 ounces per annum.
Production from the Nevada division was from the Isabella deposit (20% of the total gold content), which is much lower grade than the Pearl deposit (80% of the total gold content). Management reported that the first bench levels in the Pearl zone were reached in Q2 2020 and the impact of its higher grade is immediately evident in the overall higher mined grade in Q3 2020. As more (higher grade) Pearl benches are exposed, the ramp-up in throughput combined with higher average grade and coupled with less waste removal should result in dramatically improving financial performance. Things are suddenly looking brighter for Gold Resource Corporation. Crux Investor estimates that the financial performance of the operations will show a great improvement in 2021 because of un-interrupted production at the Arista mine in Mexico, much higher assumed metal prices than in the first nine months of 2020, and the Nevada operation expected to have fully ramped-up with much higher grade processed. A triple-whammy of good news for beaten-up shareholders.
This valuation arrives at net free cash flow in 2021 in excess of US$85 M based on a production forecast of almost 69,000 oz. The modelled gold production well exceeds target rate, reflecting a grade which assumes some stockpiled material to be treated at the end of life of mine and not in 2021. In practice net free cash flow will be somewhat lower because Crux Investor has not included a figure for exploration expenditure in the model.
The valuation has assumed the Mexican operation to be able to replenish the 31 December 2019 reserves at least one time over for a life of mine (“LOM”) until the beginning of 2029. This report presents a number of arguments why this assumption is not unreasonable. For the Nevada operations, however, it has used only the 31 December 2019 reserves showing a mine-life to 2024. Although there are good prospects for additional discoveries in Nevada, the exploration is at an earlier stage, the data more scant, and therefore the ability to forecast new resources of a given tonnes and grade is much reduced.
On a risk-adjusted basis, this Crux Investor valuation arrives at a NPV5 of US$292 M for the Mexican division, or the Oaxaca Mining Unit as they call it, as of 1 January 2021. Furthermore, the Nevada division, or the Nevada Mining Unit, has an NPV5 of US$151 M, on the same timeframe. Combined, this equates to US$391 M of total group value after accounting for corporate overheads. The Enterprise Value of GORO on 30 November 2020 was US$166 M, which translates to a value of US$126/oz Au Eq. “Zounds” I hear you say, surely that is a big discrepancy in value and investors will flock to the stock? Well, yes, er, and no.
Victories can be recorded in the higher metal prices, resumption of operations in Arista, and full production at Isabella Pearl. Hurrah, and trebles all round. Unfortunately, however, the company has not performed well during the course of 2020. Since the start of the year the GDX is up 23% (even with a major pull back in the past three months), but GORO is down 43%.
It is hard to put a finger on why the stock has underperformed so badly this year. GORO is not the only company to have its operations derailed temporarily by the pandemic, and Isabella Pear has really made up for it in the most recent quarter. GORO lost a lot of value in the last quarter of the year, after it announced that it would spinning out the Nevada Mining Unit, but many other gold companies also lost a lot of value in the same period, down approximately a third in value across the board. So it wasn’t just the split, and GORO has been underperforming for much of the year. Perhaps management started canvassing investors about the split early in the year, and the result was net selling but with investors selling rather than attempting to persuade management not to pursue the split? Who knows?
What we do know is that selling volumes have been high, the share price has fallen considerably since the spinco announcement, and just two days after the first announcement the Company had to publish an explainer in the form of a Frequently Asked Questions document, on 7 October. The FAQs noted that “In a spin-off where each company is going to take a different business strategy, we expect the share registry to change. In addition, certain institutional shareholders cannot own OTC stock and may sell due to their internal requirements of their own self-imposed charters”. Crux Investor is intrigued by the phrase “each company is going to take a different business strategy”. Does this mean that the Mexican Unit is going to be the designated dividend payer? And that the Nevada Unit is going to be the designated growth stock? We can only speculate. What is clear is that Crux Investor does not believe that two small companies are better than one growing mid-tier company, and it seems that the market holds the same view. Having just spent five years growing critical mass, and building up a decent institutional shareholder register with decent daily volume, and striving hard to leave the tag of a junior minor behind, it seems shortsighted to create two short-mine-life-junior-miners at a stroke. Management rationale for the split is that “…far greater value can be created with two independent companies compared to the value that could be achieved by keeping the mining units together.” Hmm, that did not pan out too well.
Still, what’s done is done. For those investors that can hold fast and weather a bumpy ride, there are now good value prospects for both of the Companies off a low base, whether dividend payer or growth prospect with a shot at life of mine extensions. The Crux Investor analysis highlights deep value in these Companies and expects the downward trend in the stock to be reversed.
DISCLOSURE: Analysts that contributed to this report own shares in GORO.
Gold Resource Corporation (“GORO”) (NYSE:GORO) is a US gold mining company with a mine in the Oaxaca state of Mexico, producing base metal concentrates (copper, lead and zinc) with precious metal credits and precious metals in doré and a gold heap leach operation in Nevada, USA.
The earliest available news release of the company is dated 14 September 2006 when it was announced that the company’s listing was accepted for the OTC-Bulletin Board under the symbol GORO. At the time the company already owned the Aguila project in Oaxaca and was carrying out exploration and delineation drilling leading to a construction decision with first production achieved early in 2010 and commercial production declared at 1 July of the same year.
Since start of operation the company prides itself that it has consistently declared dividends (monthly!) to its shareholders despite substantial investments in proving up additional reserves and financing a plant expansion and adding process circuits.
With production from the Mexican project area reaching a level where it was difficult to replenish reserves faster than they were being mined, and therefore not providing obvious growth opportunities, GORO started to pick up precious metal mineral rights in Nevada, USA. It started with an option agreement in November 2015 on the Gold Mesa prospect and in August 2016 with the acquisition of the Mina Gold and Isabella-Pearl prospects, all in close proximity of each other. The company gives sketchy information on the acquisition cost, but these seem to be minor, except for Isabella-Pear, which amounted to US$13 M in shares and US$0.3 M in cash for a well-advanced prospect with 0.19 Moz gold in mineral resources. The cost per resource of US$69 was not onerous at all considering the high-grade nature of the deposit and low cost for development and operation. GORO has since added other rights through acquisition (i.e. East Camp Douglas in January 2017 and County Line in March 2018) and independent staking of ground.
Following a positive feasibility study in April 2018 the Isabella Pearl project was developed and first production achieved in April 2019 with commercial production declared in October 2019.
Figure 1_1 shows the share price performance since mid-September 2006.
The graph shows that the share price had a spectacular rise from 2009 onwards when commencement of production coincided with strongly performing precious metal prices. With the collapse in precious metal prices in 2013 financial performance was correspondingly affected and the share price performed accordingly.

The Nevada asset acquisitions seem to have excited the market as the share price saw some upticks during and after 2016, the latest in the second half of 2019 with Isabella Pearl getting into production. In early 2020 the COVID-19 restrictions imposed on both the Mexican and US operations interrupted the improving financial prospects.
The drop in the share price in the past three months coincides with the plan of the company to spin off the Nevadan Unit as a separate listed company, to be called Fortitude Gold Corporation (“Fortitude”), and a general sell-off in gold stocks across the board. Management believes the division of the company will create value for the shareholders for a number of reasons.
The primary reasons for the split were spelt out in an announcement on 5 October:
- Permit each company to focus on its own unique strategic business plan
- Allow each company flexibility to allocate resources and deploy capital in a manner consistent with its own business strategy
- Unlock a value premium for the Nevada Mining Unit due to its location in one of the world’s premier mining jurisdictions
- Allow each company to focus on streamlining each distinct operation – underground, hard rock operations in Mexico, and open-pit heap leach operations in Nevada, USA
- Two separate companies have the potential to provide investors with greater value than a single combined company
Crux Investor, however, disagrees with most of these reasons, principally because the Company had just regained critical mass and a mid-tier company with operational flexibility is much, much stronger than two single asset junior minor companies that run the risk of being capital-constrained. Still, the decision has been made, and investors have to look at the value proposition from the current position.
The poor share price performance since the split has, however, highlighted a number problem. The company holding the Nevadan unit will not qualify for a Main Board listing until it has sufficient operating track record so it is banished to the relative wilderness of an OTC listing. And as many of the institutional shareholders, which accounted for 45% of shares held just before the announcement, are forbidden to hold OTC listed shares, there has been a sharp sell-off.
With the spin-off targeted to be completed by the end of 2020 or the first quarter of 2021 and a dramatic sell-off already in the price, investors now have the opportunity to buy a value proposition today.
Historical Performance
Table 2_1 gives the historical operational and financial performance from 1 January 2010 until 30 September 2020 for Gold Resource Corporation.

The table shows that operationally:
- The milled throughput at the Mexican operation has been climbing consistently since 2011 until 2019 with the trend interrupted in 2020 due to the COVID-19 restrictions imposed on the company.
- Over the same period the precious metal grade has been dropping steadily by around half for gold and 76% for silver, but with base metal grades climbing, especially zinc. The operation has become increasingly a base metal producer.
- Revenue expressed as gold equivalent ounces sold peaked in 2013 when almost 0.83Moz were sold. In 2019 the gold equivalent revenue was below 2011 levels, the first full year of production.
- The contribution of base metal revenue to total gross revenue before transport charges increased from 11% to 57% in 2018, the year before the Nevada unit started contributing to revenue. By the end of 2018 the company’s name - Gold Resource Corporation - was a misnomer
- Through starting production in Nevada the company is reverting back to becoming predominantly a precious metal company.
The table shows that financially:
- Annual revenue between 2011 and 2018, the year before the Nevada operation started to contribute, averaged US$110 M with plant throughput increases substantially mitigating the drop in precious metal prices and drop in precious metal grades.
- The Mexican operation was a money spinner during the first three years of production allowing the company to return US$92 M cash to its shareholders, which is 1.7x the funds raised from shareholders in 2010.
- With sharply dropping precious metal grades and precious metal prices the company became first marginal cash positive net of investments during the period 2014-2017, and thereafter clearly cash negative, with development of the Nevadan operation creating an extra cash burden.
- GORO’s management takes great pride in consistently paying out dividends on a monthly basis since 2011, returning more than US$106 M by December 2016. Dividend payments thereafter are however more than covered by equity placements and must been seen as somewhat artificial. Over the last 2¾ years the company tapped the equity market for US$43 M support.
- The company seems to have turned financially during 2020 with net free cash flow from operations minus investments. What the table does not show is that the positive free cash flow of US$4.9 M for the nine months of 2020 is purely because of Q3 2020 performance which more than covered the negative US$7.5 M cash flow from operations minus investments for H1 2020.
The next sections will see whether the company can regain its status as a ‘real gold mine’.
Valuation Of The Oaxaca Mining Unit
Background
The technical information in his report has been mostly drawn from a technical report by GORO in support of an updated reserve estimation, effective 31 December 2019. Some reference was made to the report for reserves effective one year earlier. For certain illustrations reference was made to corporate presentations dated March 2018 and August 2020.
The Oaxaca Mining Unit comprises the Aguila Project and five other properties, which are 100% held by GORO.
The Oaxaca Mining Unit projects are located in the Sierra Madre del Sur Mountains of southern Mexico, in the central part of the State of Oaxaca (see Figure 3.1_1).
The projects are located along a major paved highway approximately 90 km to 120 km southeast of Oaxaca City, the state’s capital city. The nearest village to the Aquila project is San Jose de Gracia at 4 km to the southeast. A gravel and paved road has been constructed from the village to the mine and mill sites which supports access by small and large vehicles. The haulage distance by road from Alta Gracia mine section to the Aguila Plant, where the ore is processed, is approximately 32 km.

GORO currently holds an interest in 29 mining concessionsin Oaxaca State totalling 55,119 hectares. Figure 3.1_2 shows the outline andextent of the tenement area.
The Aguila area (rights located on the right, e.g. no. 1,2, 3, 27) has been secured through a lease agreement and is subject to a 4% netsmelter return (“NSR”) royalty where production is sold in the form ofgold/silver doré and 5% for production sold in concentrate form.
The rights to El Chacal (no. 4), El Pilon (no. 5) and theEl Rey (no. 21) mineral rights have also been obtained through an agreementwith a third party and are subject to a 2% royalty.
GORO has secured from the Mexican government additionalconcessions for the Oaxaca Mining Unit, referred to as El Pitayo 1 to 4, ElTalaje, El Coyote, El Zorrito, San Luis, La Curva, La Herradura, David Fracción1 and 2, El Chamizo, Zopi, San Miguel Fracción 2, El Aguila III, Correcaminosand Tlacuache that total an additional 45,029 hectares.
The Rey property area in the northwest of 2,335 hectaresincludes the El Rey rights plus additional rights obtained through claimstaking.
The San Pedro Fracción 1 (no. 25) and San Pedro Fracción2 (no. 26) concessions were acquired from Almaden Minerals Ltd. (“Almaden”) andare subject to a 2% net smelter return royalty.
The technical report only includes resources and reservesfor the Aguila project area (around the operating La Arista mine) shown on theeastern side of the map in Figure 3.1_2 and Alta Gracia in the centre. This note will therefore confine itself to discuss the deposits in these areas.

Geology and Mineralisation
The regional geology is dominated by multiple volcanic domes of various scales, and suspected non-vented intrusive domes, which are imposed on a pre-volcanic basement of sedimentary rocks. Gold, silver and base metal mineralisation in this district is related to this volcanogenic system. Mineral deposits are situated along a 55 km NW– SE mineralised trend, which is hosted by volcanic, sedimentary, igneous, and metamorphic rocks. The stratigraphy of the area ranges from older sedimentary rocks that have been intensely deformed by compressional forces to younger sub-aerial volcanic rocks, which have been affected by extensional deformation.
Figure 3.2_1 shows the geological map for the Aguila project area, extracted from the 2018 report, illustrating the close association of the deposits and exploration targets with fault structures.

An early structural direction oriented northwest - southeast is related to a compressional strike slip phase (see plan at the top of Figure 3.2_2), which were mineralised and which have later been displaced by strike slip structures oriented with a more northerly azimuth direction forces (see the clockwise shift of the direction of the thick arrows in the plan at the bottom).

The mineralisation is interpreted to be of an epithermal nature, which means that the deposits were formed near the surface, usually associated with hot springs and to depths in the order of a few hundred metres. The metal was dropped out of the circulating thermal waters when it reached a level where the hydrostatic pressure was low enough to allow boiling. The deposition therefore occurs under very specific temperature, pressure and chemistry conditions, and localised mineralisation manifests as high-grades over a relatively limited vertical extent. However, when repeated healing and reopening of host structures occur, vertical movement of the boiling zone can result in mineralisation that spans a much broader range of elevation.
The minimum and maximum elevations of the mineralised horizons at the Oaxaca Mining Unit have not yet been established, but current production spans a vertical elevation range of approximately 400 m, from 850 m down to 450 m elevation above mean sea level (“amsl”). The mineralised horizon has been extended by drilling another 250 m vertically, down to 200 m amsl.
The hydrothermal fluid can travel along discrete fractures creating vein deposits, or it can travel through permeable lithology, where it may deposit its metal load in a disseminated fashion. Overall, the style of mineralisation is pinch-and-swell on structure with some flexures resulting in closures and others generating wide sigmoidal breccia zones. Vein intersections are locally the site of important historic bonanzas.
Figure 3.2_3 show a schematic southwest-northeast cross section through the Arista and Switchback vein systems, which are in the northeast corner of Figure 3.2_1.

The economic mineralisation at the Arista Mine is gold, silver, copper, lead and zinc occurring in structurally-controlled veins and stockwork zones consisting of concentrations of sulphides. Underground production and exploration of the Arista vein has developed more than 600 m of ore grade mineralisation along strike on multiple levels.
In the Switchback area, 500 m northeast of Arista, mineralisation consisting of multiple sub-parallel veins and splays of varying length and width hosted in volcanic rock (brown in Figure 3.2_3) and associated with intrusive dykes (pink). To-date, seven major veins have been identified in drill holes: Soledad, Sofia, Selene, Silvia, Sabrina, Sagrario and Susana. The mineralisation occurs mainly as pyrite (FeS2) with varying amounts of sphalerite (ZnS), galena (PbS) and chalcopyrite (CuFeS2). Base metals occur here in at a somewhat higher concentration that at Arista.
Figure 3.2_4 shows the location of Switchback relative to Arista and how these were explored in the early stages by drilling from Arista.

The structurally-controlled epithermal veins andstockwork zones at Alta Gracia Project contain mainly silver-gold bearingsulphides without base metals.
Figure 3.2_5 shows the mineralised structures at AltaGracia, which here are narrow veins (<2 m) dominantly orientednortheast-southwest (red lines) and displaced later by northwest-southeaststructures (blue lines).

Mineral Resources and Reserves
Introduction
GORO, being a US listed company, used to follow Guide 7 of the Security and Exchange Commission (“SEC”) for declaring reserves. The procedure differs from technical codes elsewhere in the world by not separating as rigorously between resources and reserves. However on 31 October 2018 the SEC amended its disclosure requirement and included mineral resources as a reportable item, granting a two-year implementation period. GORO has decided to adopt the new rules for the 31 December 2019 reserve estimation.
Estimation of Mineral Resources
The database used for the resource estimation includes 91,164 drill holes for 85,591 m and 64,649 channel and trench samples for 60,072 m.
Wireframes were developed from cross sections oriented perpendicular to the overall trend of mineralisation. Where underground channel sampling is present, the channel samples were treated as a drillhole. The outlines of the wireframes were determined by the defined economic cut-off with demonstrated continuity between sections and include low-grade material where necessary to maintain continuity. A total of 43 individual wireframes were modelled for the Arista system, 27 for the Switchback system, and 14 for the Alta Gracia system. The derived wireframes were used for rock coding, statistical analysis and compositing limits.
Figure 3.3.2_1 shows a plan view and cross section of the wireframes for Arista and Switchback.


Figure 3.3.2_2 contains a 3-dimensional view of the wireframes for Alta Gracia.

Generally, the model blocks are fixed in size at 1.0 m vertically and 1.0 m horizontally, parallel to the average strike of the vein system. Perpendicular to strike the thickness is determined by the actual width of the individual vein, and block resolution was set to 0.1 metre in the cross-strike direction.
Individual block grades were then used to calculate an NSR and a gold equivalent block model assuming metal prices of.
For the Arista and Switchback vein systems, mineralised zones were defined based on a nominal drill-hole intercept of a composited 1.5 m of assay length that had a minimum average net smelter return (“NSR”) value above US$76 per tonne using three-year trailing average prices for gold, silver, copper, lead and zinc (i.e. US$1,306/oz Au, US$16.32/ oz Ag, US$2.83/lb Cu, US$0.99/lb Pb and US$1.27/lb Zn). For the Alta Gracia vein system, mineralised zones were defined based on a composited drill hole intercept that had a minimum gold-equivalent grade of 2.5 g/t.
Spatial grade continuity and grade trends were modelled using the overall best fit strike and dip of the individual vein. The modelled continuity was used to define the overall orientation of the search ellipsoid for each individual vein. Anisotropic inverse distance cubed (“ID3”) linear weighting of capped composite values was used for the estimation of Au and Ag block grades. For the estimation of Cu, Pb and Zn block grades anisotropic inverse distance squared (“ID2”) linear weighting of capped composite values was used.
Table 3.3.2_1 summarises the mineral resources as at 31 December 2019.

The numbers in the table illustrate the higher base metalconcentrations at Switchback compared to Arista. This probably reflects a metalzonation with higher precious metals closer to surface (especially consideringthe much higher metal grades at Arista in the early years) and increasing basemetal grade with depth. Arista and Switchback are clearly the most importantdeposit areas, each contribution approximately equally to total resources.
Estimation of Mineral Reserves
The mineral reserves estimation is based on currently employed underground mining methods with the following dilution and mining recovery factors:

The table shown above contains numbers from GORO public documents. Crux Investor, however, fails to see how the average mining recovery is 84% (too low) and the average dilution is 26% (too high) relate to the individual values. Crux Investor has made minor adjustments to the dilution and mining recoveries in its modelling. Total dilution is the results of planned dilution (designing to a minimum mining width), unplanned dilution (mining beyond design) and loading dilution (scraping 0.1 m of the floor). For planned dilution a minimum operational width of 1.5 m has been assumed for Longhole Open Stoping, 1.8 m for Shrinkage mining and 2.5 m for Cut & Fill mining. The overbreak (= unplanned dilution) assumed for these methods is respectively 0.4 m, 0.2 m and 0.6 m. Development drifting is at 3 m width with an assumed overbreak of 0.5 m.
Due to the very high contribution of base metals to revenue GORO has started to use NSR-value including off-take terms and off-mine charges to determine the value of each block in order to decide whether it is part of reserves or not, by applying a cut-off value of US$76 per diluted tonne. For Alta Gracia a gold equivalent cut-off grade of 2.5 g/t has been used.
Table 3.3.3_1 shows the NSR and Au equivalent multiplier values used for breakeven cut-off grade calculations.

The table indicates that one gram of silver contributesUS$0.32 to the NSR and that 80.03 grams are required at Alta Gracia to equalone gram gold content.
GORO claims the cut-off grade of US$76/t NSR is based onactual average cash operating cost for the 12-month period for the year ending31 December 2019, reproduced in Table 3.3.3_2, but also accounting for off-taketerms, royalties and metallurgical recoveries.

The breakeven NSR cut-off grade is applied to theestimated Proven and Probable reserve blocks, and those that exceed thebreakeven NSR cut-off grade are considered for inclusion in the mine plan andfor reporting as reserves.
The vein solids (= three dimensional shapes in the modelof the mine) are cut into benches and drifts and then subdivided into selectivemining units (“SMU’s”), which are usually 15 m along the strike direction ofthe vein. Typically, especially in new mining areas, heights are 4 m high fordrifts and 16 m high for benches.

Figure 3.3.3_1 shows an example of a vein divided into SMU’s.
In preparation to reporting reserves blocks that have been mined out are removed, blocks that are accessible using current mining practices are identified and solids of satellite bodies discarded that are too far from the primary infrastructure and do not warrant the investment to access them.
An infrastructure filter is also undertaken. This mainly consists of discarding any SMU solids of satellite bodies, which are too far from the primary infrastructure and development to make accessing them economically justifiable.
Table 3.3.3_3 gives the reserve statement, effective 31 December 2019.

Comparison between the Resources table (3.3.3_2) and the Reserves table (3.3.3_3) shows that just over half of the precious metal contained in M&I resources at Arista and Switchback is converted to reserves at a grade that is higher for all metals, in particular for silver and copper, despite considerable dilution. The higher grades in the reserve figures is probably an effect of more conservative input parameters being used when compared to the parameters used for resource estimation.
When reviewing the reserves per structure it is evident that of the 43 structures contributing (22 at Arista, 14 at Switchback, and 7 at Alta Gracia) the 10 largest deposits account for more than 78% of the gold content and more than 74% of the silver content. Of these ten deposits Switchback has three and Alta Gracia none. By far the biggest deposit is Soledad at Switchback, which contains 43% of all gold and one third of all silver.
Mineralised Material
Despite GORO having adopted the new reporting regulations its 2019 reserve estimation reports still reports “mineralized material” as per the old regulations, defined as “a mineralized body that has been delineated by appropriate drilling and/or underground sampling to establish continuity and support an estimate of tonnage and an average grade of the selected metal(s)”. In addition it also reports Mineral
Resources which “do not qualify as Mineral Reserves nor Mineralised Material”.
GORO management is obviously still struggling to make the jump from the old method to the new method of resource classification. GORO has defined Mineral Resources at a cut-off grade of US$76/t, but the proportion without demonstrated economic viability was not converted to Mineral Reserves. The unconverted portion is therefore the same as Mineralised Material. This report has ignored the numbers reported for Mineralised Material.
Just to clarify, there are three types of classification here: Mineralised Material, Mineral Resources and Mineral Reserves.
Mineralised Material does not have an economic cut-off applied to it, but it has been drilled out so that estimates of grade / tonnes can be made. This old-fashioned classification is being phased out as it does not fit in with US regulations (or indeed with NI 43-101 or JORC standards). Nowadays it is not enough to know that mineralised material exists to qualify as a resource, it has to be reported within a set of economic assumptions and controls.
Resources and Reserves, of course, have economic parameters included in the calculation, with Reserves under tighter control, further de-risked, than Resources.
Although having made the conversion to the new system of Reserves and Resources, GORO still includes estimates of Mineralised Material. Perhaps this is to show the geological continuity of the orebody, and to provide comfort that a conversion to Resources and thence to Reserves is possible in the future? Whatever the reason, it is a minor quibble, and for want of much else to complain about, Crux Investor will call it a Red Flag.
Production Reconciliation
The company includes the findings of a reconciliation exercise carried out using production statistics in 2019. Table 3.3.5_1 shows the results of reconciliation of actual production against planned production.


The light-grey highlighted cells show a very material difference between actual grade mined and planned grade, particularly for gold, and much lower actual blasted tonnage, which according to GORO management could indicate an over-projection of higher grades into sparsely drilled areas. The explanation is however not entirely satisfactory as the difference for gold is much higher than for the other metals. In addition, it fails to explain the difference between planned tonnage production and actual tonnes shipped.
The dark-grey highlighted cells show a difference in the amounts processed (treated) and the amounts mined (shipped). The explanation is that 21,822 tonnes were stockpiled for treatment in 2020, but in turn this raises the question as to whether there was any stockpiling 2018 to 2019. The treated grade consistently exceeds the grade predicted by grade control measures. GORO does however ignore this as being within 10% and therefore acceptable.
The overall discrepancy between processed and planned production is material for tonnage and gold and zinc grade (see light-purple highlighted cells).
Mining Operations
The latest technical report is a much-abbreviated version of the report two years older and basically ignores properly discussing mining and processing. For this reason reference was made to 2018 technical report with the December 2017 reserve estimation.
The Primary access to the Arista mine is via a haulage decline ramp with its portal at the exhausted Aire Creek open pit at 902 metres above mean sea level (“amsl”). The decline has a minus 10% gradient and had reached by 31 December 2017 the 27 Level for a total length of 4,200 m.
Current underground mine planning and exploitation is based on a typical vertical separation of mine levels of approximately 18 m.
Figure 3.4_1 shows an isometric view of the main underground infrastructure at Arista mine.

The main mining methods used at Arista are longhole open stoping (“LHOS”), mechanised cut and fill (“MCF”) and shrinkage (“SH”). Apart from mentioning that LHOS is the preferred method where conditions allow, GORO does not give details about the proportional contribution of each method to production.
Processing Operations
The plant consists of two main process flows: a flotation plant for concentrating base metal sulphides and an agitated leaching plant for treating precious metal material with little base metals.
The flow sheet for the flotation plant includes two stages of crushing to -95 mm, subsequently milled to 55% passing (P55) 74 μm, which is then sent to the flotation circuits where first a copper rougher concentrate is produced, then a lead rougher concentrate and finally a rougher zinc concentrate. Each of the rougher concentrate is then cleaned by further flotation. The tailings of the lead cleaning flotation cells are combined with the zinc rougher concentrate for treatment in the zinc cleaning flotation cells. To improve gold recovery a Knelson gravity concentrator has been added in 2013 to the comminution section.
Water is removed from each concentrate by press filters.
The agitated leach plant has its own grinding circuit and uses zinc to precipitate gold (in the industry referred to as the Merrill Crow process) with the sludge sent for melting to doré.
In 2019 the metallurgical recoveries were 78% for gold, 90% for silver, 78% for copper, 78% for lead and 81% for zinc. With a drop in precious metal grades the recoveries have deteriorated. Silver recovery was 92% in 2016 when the feed grade was 139 g/t, and gold recovery was 90% in 2016 when the feed grade was 2.13 g/t Au.
Economic Valuation – Oaxaca Mining Unit
Introduction
Whereas the GORO makes a big issue in its technical report of the definition “mineral reserves” requiring establishing these to be economically mineable, it does not provide the information and cash flow modelling to prove such. Crux Investor feels that the economic assumptions should be made public so that analysts can judge for themselves whether companies are making valid assumptions based on benchmark figures and hard-won experience. Nevertheless, the stock exchanges allow operating companies to run with private ‘economic assumptions’. Never fear, Crux Investor has used broad assumptions based on cost information, decades of experience, and benchmark figures to fill in the gaps and thereby draw up a cash flow model.
Metal Prices Assumed and Offtake Terms
For the Base Case of this valuation, the spot prices on 30 November 2020, US$1,777/oz Au, US$22.65/oz Ag, US$3.46/lb Cu, US$0.94/lb Pb and US$1.26/lb Zn were used to determine the value of the discounted cash flow.
As a short cut to calculate the at-mine revenue the average payabilities for each metal as reported by GORO for the 2½ years up to H1 2020 have been used instead of calculating the concentrate values. Without sufficient information on process flow, mass pull and recoveries a first principle calculation is not possible.
The off-mine charges for transport, treatment and refining has been derived as the difference between total revenue received derived from payable metal multiplied by realised prices minus the reported revenue for the mining unit. Expressed per tonne milled the rate varies greatly between years. In the early years this was approx. US$50/t dropping to as low as US$9.1/t in 2018 and since rising again to US$25/t in the first nine months of 2020. For this valuation a rate of US$30/t has been assumed.
Production Schedule
The technical report being without a production schedule, this valuation had to draw up a speculative schedule assuming that twice the 31 December 2019 reserves will eventually be mined.
Table 3.6.3_1 shows the declared reserves over time for the Arista mine complex to illustrate GORO has successfully replenished and even increased its reserves over time, levelling off in the last two years.


The declared reserves are sufficient to support mining until early 2024 at a plant throughput rate of 0.6 Mtpa from 1 January 2021 onwards. By assuming the company will be successful replenishing existing reserves one time over mine closure would occur early in 2029.
Grades have assumed to be equal to the 31 December 2019 reserve grades.
In the corporate presentation dated August 2020 slides are included by GORO management to demonstrate the potential for replacement of resources, especially at Switchback and a “third parallel system” (refer to Figure 3.6.3_1).

The third parallel vein system is based on an exploration model indicating vein systems are present in parallel NW-SE zones within a structural corridor that trends NE-SW (see Figure 3.6.3_2).

According to a slide the vein systems express themselvesas ridges on surface, which should give extra confidence about the validity ofthe model.
On the plan an underground exploration drive is indicatedin green which will serve as drill platform to test the northwest continuationof the Switchback system and the possibility of a parallel system to thenortheast. Not shown, but indicated on another slide is a similar explorationdrive developed to the south east at Switchback.
In the light of the exploration potential highlightedabove, including double the 2019 reserves in a production schedule is notunreasonable.
Operating Expenditure
Table 3.6.4_1 gives the breakdown of cash cost as per2017 reserve estimation and compares this with the total cash cost as per audited annual financial statements for 2017, confirming that the two reconcile well.

The latest technical report does not give such a breakdown and does not really substantiate the decline in unit operating cost rates for mining, processing and G&A used for the mineral reserve cut-off grade estimation. This valuation has therefore assumed a similar cost structure as for 2017.
Capital Expenditure
The technical report also does not provide information on capital expenditure required in future, not even the investment required for 2020. For this reason reference was made for capital expenditure in the 2017 reserve estimation report , which has been reproduced in Table 3.6.5_1, compared to actually reported expenditure in the subsequent years.

The sustaining capital expenditure in 2017 as per the technical report does not reconcile with the number reported in the annual financial statement for that year. Crux Investor could not establish the reason for this discrepancy. Whereas sustaining capital expenditure has dropped since 2017, total capital expenditure has been not that different, which could point to a reclassification of certain items to “growth” capital expenditure.
This valuation’s cash flow model assumes capital expenditure remaining at 2019 levels, but declining three years before mine closure to two thirds of 2017 level, half in the year before closure and nil in the last production year.
The closure and rehabilitation cost have been estimated at US$3.5 M according to the 2017 reserve estimation report.
Working Capital
This valuation assumes that the mine is currently fully funded in terms of net current assets. No adjustments for working capital at the end of life have been made as Enterprise Value figures adjust for working capital.
Royalties and Taxes
The lease agreement for the Aquila area is subject to a 4% NSR royalty where production is sold in the form of gold/silver doré and 5% for production sold in concentrate.
The Mexican tax regulations include:
- An “environmental protection fee” of 0.5% on gross revenue from precious metals.
- A “Special Mining Tax” at 7.5% of the Earnings Before Interest, Taxes, Depreciation and Amortisation (EBITDA). This charge is deductible for income tax purposes
- Change from accelerated amortisation of pre-production investment to a 10% rate on a straight line basis, but allowing for accelerated depreciation when the LOM is shorter, resulting in full depreciation upon mine closure.
- The income taxes are currently 30%.
- Tax on expatriation of dividends a 10%, but according to GORO in terms of existing US-Mexico tax treaty the applicable rate to the company is 5%.
The technical report and financial statements do not identify the balance allowed for tax depreciation and this valuation has generated a schedule using the balance for Property, Plant and Equipment at 2011, just after start of production and annual capital expenditure at the Oaxaca Unit calculate tax allowances claimed assuming 10% per annum. This underestimates the allowances claimed in the early years when accelerated depreciation was allowed in terms of Mexican tax regulations, but this introduces only a minor optimistic bias as early capital expenditure was minor compared to current outlays.
Results
Table 3.6.8_1 summarises the LOM results for Base Case metal prices and the input parameters set out above for the period 1 January 2021 onwards assuming only the 31 December 2019 reserves will be depleted and twice this amount will eventually become available.


The operating cash margin for both scenarios is justbelow 52%, which is very good for a mature mine. However, Mexican taxregulations impose a high burden absorbing approximately 29% of the EBITDA forboth scenarios. Being an underground mine, the longer LOM scenario absorbsanother 19% of EBITDA for capital expenditure leaving almost 51% of EBITDA fordistribution to shareholders. This increases to more than 56% for the shorterLOM as capital expenditure drops off as the mine nears closure.
The net present value at a discount rate of 5% (“NPV5”)for the shorter LOM is US$164 M which increases to US$292 M should the longerLOM be achieved. Every additional year of production adds approximately US$35 Mto NPV5.
Table 3.6.8_2 explores the sensitivity of the net present values to change in the metal prices and cash operating cost for the longer LOM scenario.

The high margin nature of Arista makes the results relatively insensitive to changes in metal prices with NPV’s changing by 2.3%for every percentage point change in these prices and by 0.8% for every percentage point change in cash operating cost. To double the NPV5 value an across the board metal price rise of 44% from current levels is required.
Valuation of the Nevada Mining Unit
Background
The technical information in his report has been mostly drawn from a technical report by GORO dated 16 February 2020 in support of an updated reserve estimation for the Isabella Pearl deposit, effective 31 December 2019. For certain illustrations reference was made to a corporate presentation dated August 2020.
The Isabella Pearl mine is located in the Gabbs Valley Range, approximately 10 km north of the town of Luning in Mineral County, Nevada. (see Figure 4.1_1).

The mine site is reached from Hawthorne travelling 40 km on US Highway 95 until Nevada State Route 361 just west from the town of Luning. The mine site is at a road distance of 10 km, first north along Route 361 then west using a dirt road.
The mine area covers approximately 198 hectares and consists of 42 unpatented lode mining claims on land owned by the U.S. government, and administered by the Bureau of Land Management (“BLM”).
Figure 4.1_2 shows the outline and extent of the tenement area with the thick black outline identifying the mine boundary.

There are ten claim areas in the extreme northwest corner which are owned 100% by GORO, 50% outright and the balance secured through a lease in terms of which there is a 3% NSR royalty payable on revenue derived from these claims. The balance of the rights is subject to a 3% NSR royalty in favour of Gateway Gold (USA) Corporation (“Gateway”), which covers the three claims designated TDG1-TDG3 and TXAU Investments Limited (TXAU”).
GORO also controls an additional 454 claims covering approximately 3,240 hectares along a nearly 30 km trend extending northwest of the Isabella Pearl mine covering a number of prospects.
Geology and Mineralisation
The Isabella Pearl mine is located in the central portion of the Walker Lane, a major northwest- trending zone on the western border of Nevada characterised by a series of closely spaced faults. Walker Lane is a complex zone up to 100 km wide and 700-900 km long.
Figure 4.2_1 shows the geological map for the mining area with the same mine boundary outline as in Figure 4.1_2 superimposed and identifying the most important fault structures: the Soda Spring Valley fault in dark blue, the Pearl Scarlet fault in red, the Civit Cat Fault in green, the Pyrite Spring fault in light blue and the Copper Cliff fault in orange.

According to the technical report, many more faults are present than shown on the map, but individual faults and related fractures and joints are so numerous, and commonly obscured by alteration, that only the principal ones have been mapped.
The fault structures are of major importance in controlling the localisation of mineralisation by creating the conduits along which the mineralising fluids could travel. A second control for mineralisation is lithology with favourable rock types causing precipitation of gold by chemically reacting to the acid gold bearing fluids.
Figure 4.2_2 shows an idealised section showing the mineralisation controls for both the lithologically controlled Isabella deposit and the structurally controlled Pearl deposit.

The deeper deposits are relatively high-grade because these environments were the first favourable environments encountered by ascending, mineralising hydrothermal fluids.
Figure 4.2_3 shows two cross sections through Isabella (top) and Pearl (bottom) after the area had been affected by post mineralisation deformation.

The cross sections show that the Isabella mineralisation is substantially above the oxide-sulphide boundary, whereas a substantial portion of the higher-grade Pearl deposit is below the oxide-sulphide boundary. For the heap leaching processing method it is important the mineralisation has been oxidised to liberate the gold and make it amenable to cyanide leaching.
Mineral Resources and Reserves
Estimation of Mineral Resources
The final mine database includes a total of 379 holesdrilled by Combined Metals- Homestake, TXAU and GORO at Isabella Pearl through2019, including 339 reverse circulation (“RC”), 33 diamond drill holes (“DDH”)and three metallurgical DDH drill holes and four water wells.
Figure 4.3.1_1 shows the drill hole collar location mapfor Isabella Pearl.

According to the technical report, many more faults are present than shown on the map, but individual faults and related fractures and joints are so numerous, and commonly obscured by alteration, that only the principal ones have been mapped.
The fault structures are of major importance in controlling the localisation of mineralisation by creating the conduits along which the mineralising fluids could travel. A second control for mineralisation is lithology with favourable rock types causing precipitation of gold by chemically reacting to the acid gold bearing fluids.
Figure 4.2_2 shows an idealised section showing the mineralisation controls for both the lithologically controlled Isabella deposit and the structurally controlled Pearl deposit.

The deeper deposits are relatively high-grade because these environments were the first favourable environments encountered by ascending, mineralising hydrothermal fluids.
Figure 4.2_3 shows two cross sections through Isabella(top) and Pearl (bottom) after the area had been affected by postmineralisation deformation.

The cross sections show that the Isabella mineralisation is substantially above the oxide-sulphide boundary, whereas a substantial portion of the higher-grade Pearl deposit is below the oxide-sulphide boundary. For the heap leaching processing method it is important the mineralisation has been oxidised to liberate the gold and make it amenable to cyanide leaching.
Mineral Resources and Reserves
Estimation of Mineral Resources
The final mine database includes a total of 379 holes drilled by Combined Metals- Homestake, TXAU and GORO at Isabella Pearl through 2019, including 339 reverse circulation (“RC”), 33 diamond drill holes (“DDH”) and three metallurgical DDH drill holes and four water wells.
Figure 4.3.1_1 shows the drill hole collar location map for Isabella Pearl.

The Isabella, Pearl, Scarlet South and Civit Cat Northdomains were modelled based on a nominal 0.30 g/t Au grade threshold. In orderto maintain continuity lower grade assay intervals were incorporated into themodelled domains where found to be appropriate. Wireframes were generated forthese domains, the result of which shown in Figure 4.3.1_2.

Pearl is shown in red, Isabella in blue, Civit Cat North in green and Scarlet South in brown.
The gold grade statistics for the various deposits show moderate coefficient of variation (“CV” = standard deviation / mean) values with 0.99 for Civit Cat North, 1.47 for Isabella, 1.81 for the Pear Main zone and 2.29 or Pearl Vein. To limit the impact of outlier high composite grades these were capped at 10 g/t for Isabella and Pearl veins, 50 g/t for Pearl Main structure and 4 g/t for Civit Cat North. This should have brought the CV values further down, but the technical report gives no details. For the Pearl deposit an additional range restriction of 40 m was placed on composites equal to or greater than 50% of the capping threshold.
For grade estimation a block size of 5 m x 5 m x 6 m was selected, which is considered representative of the selective mining unt (“SMU”). Estimation methods used were Inverse distance cubed (“ID3”), ordinary kriging (“OK”) and Nearest Neighbour (“NN”) weighting of capped composite values. The main search directions are parallel to the strike and dip of the deposits.
Figure 4.3.1_3 shows a typical cross section looking northwest through the gold block model.

The conceptual pit outline for reporting resources that are potentially economic assumes a gold price of US$1,306/oz, a 3% royalty, a recovery of 81% from crushed material, mining cost of between US$2.76/t and US$2.99/t depending on the type of material, processing cost of US$9.26/t and G&A of US$5.26/t for a cut-off grade of 0.44 g/t Au.
The bottom of the pit shell has not been taken below the water table and all sulphide mineralisation not amenable to heap leaching has been treated as waste.
Table 4.3.1_1 summarises the mineral resources as at 31 December 2019.

Estimation of Mineral Reserves
For the estimation of mineral reserves conventional open pit mining and heap leach processing was assumed. The same economic input parameters were used as for the resource estimation.
GORO assumes that the dilution created by including waste in the SMU of 5 m x 5 m x 6 m adequately accounts for total dilution. It therefore ignores dilution caused from mixing blasted or from defined ore and waste blocks. This is somewhat optimistic but given the width of the deposits compared to block size (refer to Figure 4.3.1_3) not serious as relatively few blocks are bordering waste.
GORO makes much of the cut-off grade applicable for the various mineralisation types and process routes (i.e. leaching of uncrushed versus crushed ore) taken, but this is actually irrelevant as is evident from the diagram in Figure 4.3.1_4.

The axes have purposefully been taken to nil to highlight the very insensitive nature of the relationship with a change on cut-off grade from 0.5 g/t to 0.6 g/t Au (i.e. 20%) resulting in a drop of 1.8% in gold content. The insensitivity of the relationship is not surprising given the fact that the grades are high relative to the low operating costs of a heap leach deposit. At such a high grade and the very low operating cost the cut-off grade will be very low. The discussion of whether
to leach crushed or uncrushed is usually a short discussion as every percentage point of recovered gold is so valuable, especially at current gold prices. The gain in recovered gold typically outweighs the extra cost of crushing the ore.
Table 4.3.2_1 gives the reserve statement effective at 31 December 2019, which is exactly the same as the resource statement, thereby assuming a 100% conversion rate.

GORO chooses not to disclose the strip ratio (the ratio of waste to ore tonnes in an open pit development) as part of the reserve statement. However under the discussion of Mining Methods it is mentioned that the pits will generate 15.8 M tonnes of waste for a strip ratio of 7.0:1
However the strip ratio mentioned under the discussion of the Isabella Pearl project on the website is 5:1, implying 11.24 Mt of waste required to be stripped. This valuation has conservatively modelled the higher number.
Mining Operations
The Isabella Pearl operation consists of one pit accessing the Isabella, Pearl and Civit Cat North deposits. Open pit mining is conducted by a contractor using conventional diesel-powered equipment of blasthole drills, wheel loaders, and 91-tonne trucks. Mining is with 6 m high benches and at an inter-ramp slope of almost 50 degrees.
Grade control uses blasthole samples to classify the material as high-grade (>0.61 g/t Au), low-grade (between 0.44 g/t and 0.61 g/t Au) and waste. Higher-grade ore is crushed before being placed on the leach pad by a stacker conveyor system and low- grade ore is hauled to a stockpile for later processing. Waste rock is stored in the waste rock facility located in close proximity to the pit.
Processing Operations
Metallurgical Testwork
Before GORO became involved the Isabella Pearl mineralisation had been subjected to nine separate programmes of metallurgical test work, the most relevant being by the Combined Metals-Homestake joint venture undertaken in 1990, and by TXAU in 2009, which focused on heap leaching as process route. Oher programmes looked at other processing methods. The results showed the material to be very amenable to heap leaching with recoveries between 64% and 89% for a particle size coarser than 1 cm.
Mineralogical examination showed that the gold In the Isabella deposit occurs as very small (<10 μm) liberated particles in cavities and along fracture surfaces and iron oxide minerals jarosite, limonite and goethite. At Pearl the gold is contained both as locked and free particles, as native and electrum in an average size of 14 μm, again associated with iron oxides, but also psilomelane (a barium manganese oxide).
GORO carried out follow-up column leach testwork in 2016-17 including tests of agglomerated material. At a crush size of 1.6 cm (5/8 inch) recovery was found to be fast and high with 76% for 0.74 g/t Au feed grade and 89% for 9.3 g/t Au.
Based on the metallurgical test work completed, recoveries are estimated at 81% for crushed ore after 4 months leaching, half of which takes place in the first month. For uncrushed ore this is estimated at 60% of which one third is recovered in the first month. Given the very large difference in recovery, GORO should not even consider not crushing its ore as it would simply leave too much money in the heap.
Cyanide consumption was expected to average 0.75 kg/t and lime 3.0 kg/t. As cyanide consumption is a function of gold grade and this grade being exceptionally high for a heap leach process, this rate is very low when compared to a heap leach operation treating 0.4 g/t Au, say. Processing.
Based on metallurgical testwork it was decided heap leaching was the most economical process route including crushing, followed by absorption/desorption recovery of the gold and melting to doré bars.
Isabella Pearl high-grade ore above the 0.61 g/t Au cut-off is crushed using a two-stage portable crushing plant to a particle size
High-grade ore is first trucked from the open pit to a stockpile located close to the primary crushing circuit. A front-end loader then feeds the high-grade ore to the crushing circuit where a stationary grizzly prevents oversized material (no detail given on what cut size is used) from making its way into the crusher cavity. The primary jaw crusher reduces the material to 80% passing (“P80”) 8 cm and fed to a secondary crusher to achieve the target particle size of P80 1.6 cm (5/8 inch). This is conveyed to the heap after adding lime at the first conveyor section.
A cyanide solution is emitted using drippers. This solution dissolves gold on its way down through the heap until it reaches the bottom where a plastic liner prevents further downward flow. The pregnant liquor is collected by 20.3 cm high-density polyethylene (“HDPE”) piping resting on the upper geomembrane, the solution flows by gravity to solid 25.4 cm HDPE outlet pipes and exits each side of the leach pad to flow to pregnant solution pond. From there it is pumped to a carbon-in-column circuit where activated carbon extracts the gold from solution. The carbon is then “stripped” from its gold by washing it with a cyanide rich solution and the gold precipitated electrolytically with the sludge melted with fluxes to generate a precious metal rich product that can be poured as doré bars.
Economic Valuation – Isabella Pearl Mine
Metal Prices Assumed and Offtake Terms
For the Base Case of this valuation, the spot prices on 30 November 2020, US$1,777/oz Au, and US$22.65/oz Ag.
For refining charges reference was made to the input-parameters for resource and reserve estimation which give a rate of 0.075% of gross revenue
Production Schedule
As the GORO technical report again does not provide a production schedule, this valuation had to draw up a speculative schedule assuming that the 31 December 2019 reserves depleted until 30 September 2020 will be depleted in Q4 of 2020 at the same rate as for Q3 2020. This valuation has only used production from January 2021 onwards.
Table 4.6.2_1 shows how the production schedule was derived taking into account estimated 2020 production and crushing at a rate of 0.70 Mtpa, which is as originally planned by Gold Resource, but is somewhat below the actual Q3 2020 crushing rate of 0.75 Mtpa.
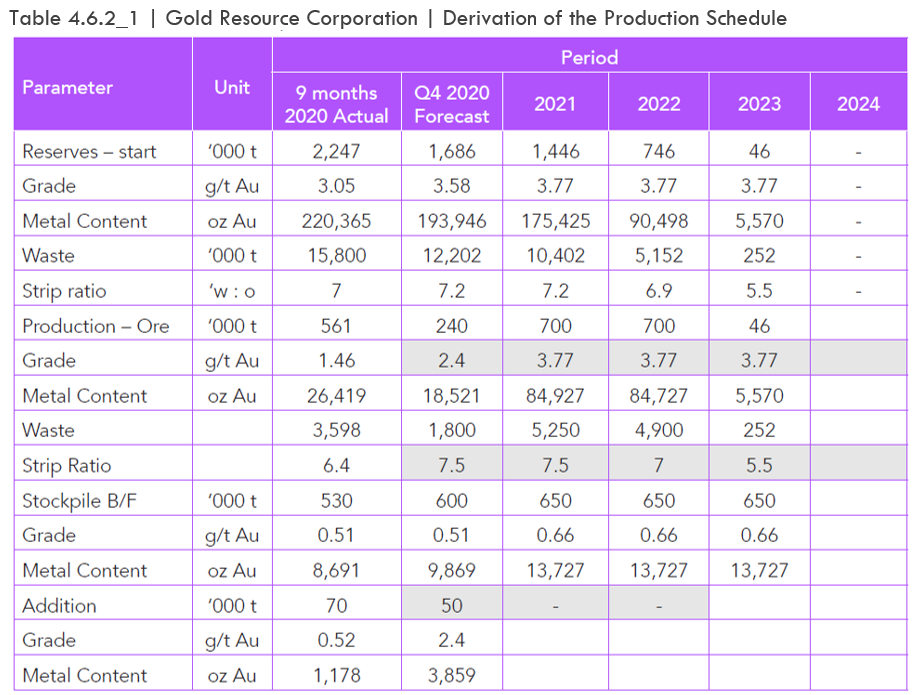

The cells highlighted light-grey contain educated guesses for grade (i.e. forecast in Q4 2020 is 40% higher than the mined Q3 2020 grade), strip ratio and additions to the stockpile. It should be noted by assuming treatment of the remaining reserve grade at start of 2021 for the year, the calculated gold production of 68,791 oz far exceeds guidance of 40,000 oz. This maybe too high, but it reduces the calculated gold production in the subsequent years. There is much uncertainty about the individual numbers, but over the short LOM these are not critical to the overall value.
Without a production schedule with silver grades, the amount of silver produced has been assumed equal to the ratio of actual silver produced over actual gold produced in 2020 which was 120%.
In Section 4.1 it was mentioned that GORO also controls an additional 454 claims covering approximately 3,240 hectares along a nearly 30 km trend extending northwest of the Isabella Pearl mine covering a number of prospects. The corporate presentation dated August 2020 includes a number of slides about the potential for finding additional resources. These can be classified as near-mine and more distant prospects. Figure 4.6.2_1 reproduces a slide with prospects near the current operation along a 10 km long corridor.

Drilling in the immediate vicinity of Isabella Pearl have encountered mineralisation over tens of metres with grades exceeding 1 g/t Au. There is however yet not sufficient information on whether these results define a consistent deposit.
Apart from the near-mine targets, the company also controls ground further away over 4 other promising targets. Figure 4.6.2_2 contains another reproduction of a slide with the location of these targets relative to Isabella Pearl.

Whereas the text on the slides includes “close proximities”, this should be taken with a pinch of salt as the closest is more than 23 km away in a straight-line. When dealing with material that needs crushing only before being leached it does not make sense to haul to the Isabella Pearl operation as the cost will quickly exceed crushing cost savings. Where the Isabella Pearl operation could give an advantage in easier permitting using existing facilities.
As there is too much uncertainty relating to exploration success, this valuation only contains the depletion of known reserves in its production schedule.
Operating and Capital Expenditure
Without guidance on operating costs this valuation has adopted the cost rates used for establishing the cut-off grade for resource and reserve estimation: US$2.80/t mined, US$9.0/t processed and US$5.26/t G&A, which amounts to US$3.4 M per annum. These are relatively high rates for the USA and should be considered conservative.
Actual sustaining capital expenditure has been low, and this valuation has ignored this for the future. In practice the company will spend considerable amounts on exploration to replenish resources, but this has been ignored as potential success from this has also been ignored as too uncertain.
Working Capital
This valuation assumes that the mine is currently fully funded in terms of net current assets. No adjustments for working capital at the end of life have been made as Enterprise Value figures adjust for working capital.
Royalties and Taxes
USA taxation is notoriously complex and the PEA report gives no details to shed light on the matter. For this reason, this valuation has also referred to two publications:
- Understanding Nevada’s Net Proceeds of Mineral Tax, 2007-2008 edition, Nevada Tax Payers Association.
- A 2012 slide presentation by PWC at the American School of Mines entitled Basics of U.S. Mining Taxation and a note by PWC with the title Corporate Income Taxes, Mining Royalties and Other Mining Taxes; A Summary of Rates and Rules in Selected Countries, dated June 2012.
Applicable taxes for mining companies in Nevada are:
- As from 1 January 2018 Federal Income Tax at 21.0%.
- Nevada Net Proceeds Tax sliding scale up to 5.0%.
The base of the Net Proceeds Tax is attributable at-mine revenue minus depreciation of the cost of machinery and equipment. Where the net proceeds of the mine are less than US$4 M, the tax rate is a function of margin, where it exceeds US$4 M, it is 5%.
The tax base for Federal Income Tax is calculated as revenue less allowable costs (presumably operating costs), Nevada Net Proceeds Tax, depreciation and the greater of cost depletion or percentage depletion. According to the PWC note on rates, a depreciation rate of 14.3% is applicable on mining investments. This has been applied to sustainable capital expenditure.
The calculation of the depletion allowance is a typical example of the overly complex US tax system.
The greater of cost depletion and percentage depletion is allowed with:
- For Cost Depletion there are three different methods, the simplest of all being a write down of the pre-production capital investment at 10% per annum.
- Percentage Depletion is the lower of a specified percentage of net metal revenue (revenue minus royalties) and 50% of net taxable income before depletion. The “specified percentages” for gold and silver is 15%.
From the documentation it seems that Percentage Depletion can be deducted annually also after recoupment of the initial capital expenditure.
Losses in a given year may be carried back two years and carried forward for 20 years, except losses incurred as a result of the reclamation costs, which may be carried back 10 years.
The technical report gives no detail on available tax-deductible balances.
Being a very high margin operation this valuation has applied 5% Nevada Net Proceeds Tax.
Results
Table 4.6.6_1 summarises the LOM results for Base Case metal prices and the input parameters set out above for the period 1 January 2021 onwards assuming only the 31 December 2019 reserves will be depleted and GORO not being able to replenish these through further exploration.


The operating cash margin is almost 74%, which is phenomenally high explained by the very high-grade nature of the reserves, the very high metallurgical recovery for a heap leaching process and the low-cost nature of the process route. The much higher margin than achieved in H1 2020 is due to ore from the Pearl deposit starting to complement in future the much lower grade Isabella ore.
The low tax burden in the USA combined with no capital expenditure results in almost 80% of EBITDA becoming available for distribution to GORO.
The net present value at a discount rate of 5% (“NPV5”) is US$151 M. Every additional year of production adds approximately US$70 M to NPV5, assuming this is at the same average grade. Whether additional discoveries will be at the same grade as current reserves is however very questionable.
Given the very high margin of the current project, it serves little purpose to carry out a sensitivity analysis.
Valuation of Gold Resources Corporation
Valuation of Consolidated Cash Flow
The valuations of the Mexican and Nevadan operations have not accounted for cash outflows at corporate level. These involve mostly corporate general and administrative expenses of approx. US$9 M per annum in cash (without stock-based compensation) and US$4 M for exploration. As it would be too onerous to account for exploration expenses without considering any value derived from success, this item has been ignored as unquantifiable. Figure 5.1.1_1 shows the annual cash flow at corporate level from the mining operation and impact of corporate overheads.

The diagram shows an amazingly high cash flow from the operations in 2021 compared to the first nine months of 2020 performance when cash flow from operations minus investments was US$4.9 M. This is explained by:
- The Arista mine assumed not being affected by any further shut downs
- The metal prices modelled at 30 November spot prices which are for gold 1% higher than realised in 2020 year to date, 13% higher for Ag, 28% higher for Cu, 17% for Pb and 31% higher for Zn. \Nevada having reached full ramp up and producing almost 70,000 oz Au compared to an annualised 22,300 oz in the first nine months of 2020.
- Nevada having reached full ramp up and producing almost 70,000 oz Au compared to an annualised 22,300 oz in the first nine months of 2020.
In practice the cash generation will be somewhat lower than shown on the diagram because for outlays on exploration, but with a much longer The NPV5 value of the corporate cash flow is US$391 M.
The Enterprise Value of Gold Resources Corporation at 30 November 2020
At the share price of US$3.00 on 30 November 2020 and with 71.85 million shares issued on 30 September 2020 according to the financial statements, the market capitalisation of GORO is US$215.6 M.
The financial statements for the quarter ending 30 September 2020 give no detail about outstanding warrants or options. For this reference has to be made to slide 41 of the corporate presentation dated which gives 4.67 million options (no information on the exercise price) and 0.20 million RSU’s. As it is not possible to calculate the net effect of dilution, this valuation has ignored it.
At 30 September 2020 the company had net current assets of US$50.02 million and with negligible debt of US$0.30 M.
Based on the above an undiluted Enterprise Value for GORO of US$165.8 M is derived as shown in Table 5_1

Red Flags
When summarising this report on GORO into a list of Red Flags and Green Lights it becomes apparent that there are technical challenges and opportunities, but also existential challenges and opportunities that the Company has attempted to address in its fashion.
On a technical level, the basic situation is that both asset bases in Mexico and in the US have decent geologies, well-run operations, and are cash generating in this metal price environment. At Aquila, the geological prognosis is that reserves can be doubled to give a mine life out to at least 2029, but no assumption has been made for expanding the resources at Isabella Pearl to extend the mine-life beyond 2023. Clearly, with each year of like-for-like reserve replacement adding ~US$80 M to the NPV5 of the project, exploration in Nevada will be a high priority for the Company.
So far so good. Where the Company struggles on the technical level is in the transition to a more transparent reporting standard and the shift to a new system of disclosure. In the reports, key bits of information are missing, leaving analysts and investors scrabbling for numbers, and being forced to make educated guesses or assumptions. Improving transparency would make understanding the investment case easier. In a world where information is key, a Company that is transparent and easily understandable will outperform a Company that is opaque and hard to decipher.
On a strategic level, the greatest challenge faced by the Company has been the dividend policy. On so many levels it has created problems for GORO. How can it be maintained? Are investors wedded to it? What role does it play in Company’s identity? Ultimately, the ability (or lack thereof) to maintain a sustainable dividend has split the company into two separate entities.
Now that the decision to split the company has been made, clarity of thought can return, and the valuation can start to trend back to a truer version of net asset value. Well, first of all the split needs to take place. And then a second wave of selling needs to be weathered, while investors cash in their ‘free’ share. Only then will the EV/NPV trend higher from its current levels of 0.53x towards the peer group at around 1x.
Keep an eye out for free cash flow and exploration news from Aquila, and exploration news and free cash flow in Nevada. These two factors will be the driver of value for GORO shareholders.
Executive Summary
Gold Resource Corporation (“GORO”) (NYSE:GORO) is a US gold mining company with an operating mine in the Oaxaca state of Mexico, producing base metal concentrates (copper, lead and zinc) with precious metal credits and precious metals in doré, and a new heap leach operation in Nevada, USA, which produces gold and silver in doré.
The company explored and developed the Aquila project in Mexico between 2006 and 2010, successfully bringing the Arista mine into production and generating so much cash that it could more than reimburse the equity capital raised in 2010 within two years of production start. The reserves declared at 31 December 2019 give the mine life until mid-2024, which is quite short. Having said that, the well-established track record of successful annual reserve replenishment means that it is reasonable to expect mine life to extend to 2029, and possibly even further. The heap leach operation in Nevada, Isabella Pearl, although new, has a mine life of less than three years. Exploration around Isabella Pearl has the explicit aim to add resources and therefore to extend mine-life.
The management, like so many resource teams, did not give the Company a proper name, instead choosing to concatenate a bunch of labels – in this case, ‘gold’ and ‘resource’ and ‘corporation’. At the beginning the label seemed to fit, but over time, however, the precious metals grade dropped. From 2014 onwards base metal grades, probably reflecting metal zonation in the deposits, steadily increased. The contribution of base metals to financial performance grew from 2014 onwards, assisted by relative commodity price moves, until base metals were the dominant revenue source in 2018. By this time the company’s moniker had become a misnomer, once again highlighting the difference between a real company name and a set of labels masquerading as a name.
In 2015 management started acquiring precious metal assets in Nevada, USA, starting with an option agreement, followed in 2016 by outright purchases. Fortunately, management has a value-focused policy, dismissing the concept of growth for growth’s sake and not overpaying for acquisitions. The most advanced rights bought were of claims covering the Isabella Pearl deposits which had defined mineral resources of 0.19 million ounces (“Moz”) at a high grade and amenable to cheap heap leaching with excellent metallurgical recoveries. In this light the consideration paid, equivalent to US$60/oz, was cheap. At a planned production rate of more than 40,000 ounces per annum, GORO would again become a predominantly precious metal producer.
Management takes great pride in having consistently paid dividends on a monthly basis since start of production at Arista. Crux Investor, however, feels that blindly sticking to a dividend policy has not always benefited shareholders. Indeed, the increase in base metal revenue from the Aquila project could not compensate for the loss of precious metal revenue from the same mine, and remember that both base and precious metal prices were in decline from 2011 to 2016. Cash flow from operations net of investments became negative to marginal in the period 2015 to 2017, and yet the dividend policy was maintained. From a peak of US$39.9 M in 2012 total dividends in the period 2017-2019 averaged only US$1.3 M per annum. Keeping paying even these small dividends in 2018 and 2019 was an artificial exercise as the equity capital raised in these years far exceeded dividends. It was a matter of taking with one hand to give with the other.
The equity raises were needed for a period of high capital investment from 2017 to 2019 to fund the development of the Isabella Pearl mine, which reached commercial production in October 2019. All things being equal apart from the rising gold price, the new mine should have resulted in a major improvement in cash generation, but then the virus struck. Production in Mexico was severely impacted by the government ordering a nearly 8-week long shutdown. Whereas in the USA gold production in Q3 2020 was almost 90% of the production in the first six months, production for the year to date was a very modest 16,747 oz Au, far below the steady state target of 40,000 ounces per annum.
Production from the Nevada division was from the Isabella deposit (20% of the total gold content), which is much lower grade than the Pearl deposit (80% of the total gold content). Management reported that the first bench levels in the Pearl zone were reached in Q2 2020 and the impact of its higher grade is immediately evident in the overall higher mined grade in Q3 2020. As more (higher grade) Pearl benches are exposed, the ramp-up in throughput combined with higher average grade and coupled with less waste removal should result in dramatically improving financial performance. Things are suddenly looking brighter for Gold Resource Corporation. Crux Investor estimates that the financial performance of the operations will show a great improvement in 2021 because of un-interrupted production at the Arista mine in Mexico, much higher assumed metal prices than in the first nine months of 2020, and the Nevada operation expected to have fully ramped-up with much higher grade processed. A triple-whammy of good news for beaten-up shareholders.
This valuation arrives at net free cash flow in 2021 in excess of US$85 M based on a production forecast of almost 69,000 oz. The modelled gold production well exceeds target rate, reflecting a grade which assumes some stockpiled material to be treated at the end of life of mine and not in 2021. In practice net free cash flow will be somewhat lower because Crux Investor has not included a figure for exploration expenditure in the model.
The valuation has assumed the Mexican operation to be able to replenish the 31 December 2019 reserves at least one time over for a life of mine (“LOM”) until the beginning of 2029. This report presents a number of arguments why this assumption is not unreasonable. For the Nevada operations, however, it has used only the 31 December 2019 reserves showing a mine-life to 2024. Although there are good prospects for additional discoveries in Nevada, the exploration is at an earlier stage, the data more scant, and therefore the ability to forecast new resources of a given tonnes and grade is much reduced.
On a risk-adjusted basis, this Crux Investor valuation arrives at a NPV5 of US$292 M for the Mexican division, or the Oaxaca Mining Unit as they call it, as of 1 January 2021. Furthermore, the Nevada division, or the Nevada Mining Unit, has an NPV5 of US$151 M, on the same timeframe. Combined, this equates to US$391 M of total group value after accounting for corporate overheads. The Enterprise Value of GORO on 30 November 2020 was US$166 M, which translates to a value of US$126/oz Au Eq. “Zounds” I hear you say, surely that is a big discrepancy in value and investors will flock to the stock? Well, yes, er, and no.
Victories can be recorded in the higher metal prices, resumption of operations in Arista, and full production at Isabella Pearl. Hurrah, and trebles all round. Unfortunately, however, the company has not performed well during the course of 2020. Since the start of the year the GDX is up 23% (even with a major pull back in the past three months), but GORO is down 43%.
It is hard to put a finger on why the stock has underperformed so badly this year. GORO is not the only company to have its operations derailed temporarily by the pandemic, and Isabella Pear has really made up for it in the most recent quarter. GORO lost a lot of value in the last quarter of the year, after it announced that it would spinning out the Nevada Mining Unit, but many other gold companies also lost a lot of value in the same period, down approximately a third in value across the board. So it wasn’t just the split, and GORO has been underperforming for much of the year. Perhaps management started canvassing investors about the split early in the year, and the result was net selling but with investors selling rather than attempting to persuade management not to pursue the split? Who knows?
What we do know is that selling volumes have been high, the share price has fallen considerably since the spinco announcement, and just two days after the first announcement the Company had to publish an explainer in the form of a Frequently Asked Questions document, on 7 October. The FAQs noted that “In a spin-off where each company is going to take a different business strategy, we expect the share registry to change. In addition, certain institutional shareholders cannot own OTC stock and may sell due to their internal requirements of their own self-imposed charters”. Crux Investor is intrigued by the phrase “each company is going to take a different business strategy”. Does this mean that the Mexican Unit is going to be the designated dividend payer? And that the Nevada Unit is going to be the designated growth stock? We can only speculate. What is clear is that Crux Investor does not believe that two small companies are better than one growing mid-tier company, and it seems that the market holds the same view. Having just spent five years growing critical mass, and building up a decent institutional shareholder register with decent daily volume, and striving hard to leave the tag of a junior minor behind, it seems shortsighted to create two short-mine-life-junior-miners at a stroke. Management rationale for the split is that “…far greater value can be created with two independent companies compared to the value that could be achieved by keeping the mining units together.” Hmm, that did not pan out too well.
Still, what’s done is done. For those investors that can hold fast and weather a bumpy ride, there are now good value prospects for both of the Companies off a low base, whether dividend payer or growth prospect with a shot at life of mine extensions. The Crux Investor analysis highlights deep value in these Companies and expects the downward trend in the stock to be reversed.
DISCLOSURE: Analysts that contributed to this report own shares in GORO.
Gold Resource Corporation (“GORO”) (NYSE:GORO) is a US gold mining company with a mine in the Oaxaca state of Mexico, producing base metal concentrates (copper, lead and zinc) with precious metal credits and precious metals in doré and a gold heap leach operation in Nevada, USA.
The earliest available news release of the company is dated 14 September 2006 when it was announced that the company’s listing was accepted for the OTC-Bulletin Board under the symbol GORO. At the time the company already owned the Aguila project in Oaxaca and was carrying out exploration and delineation drilling leading to a construction decision with first production achieved early in 2010 and commercial production declared at 1 July of the same year.
Since start of operation the company prides itself that it has consistently declared dividends (monthly!) to its shareholders despite substantial investments in proving up additional reserves and financing a plant expansion and adding process circuits.
With production from the Mexican project area reaching a level where it was difficult to replenish reserves faster than they were being mined, and therefore not providing obvious growth opportunities, GORO started to pick up precious metal mineral rights in Nevada, USA. It started with an option agreement in November 2015 on the Gold Mesa prospect and in August 2016 with the acquisition of the Mina Gold and Isabella-Pearl prospects, all in close proximity of each other. The company gives sketchy information on the acquisition cost, but these seem to be minor, except for Isabella-Pear, which amounted to US$13 M in shares and US$0.3 M in cash for a well-advanced prospect with 0.19 Moz gold in mineral resources. The cost per resource of US$69 was not onerous at all considering the high-grade nature of the deposit and low cost for development and operation. GORO has since added other rights through acquisition (i.e. East Camp Douglas in January 2017 and County Line in March 2018) and independent staking of ground.
Following a positive feasibility study in April 2018 the Isabella Pearl project was developed and first production achieved in April 2019 with commercial production declared in October 2019.
Figure 1_1 shows the share price performance since mid-September 2006.
The graph shows that the share price had a spectacular rise from 2009 onwards when commencement of production coincided with strongly performing precious metal prices. With the collapse in precious metal prices in 2013 financial performance was correspondingly affected and the share price performed accordingly.
The Nevada asset acquisitions seem to have excited the market as the share price saw some upticks during and after 2016, the latest in the second half of 2019 with Isabella Pearl getting into production. In early 2020 the COVID-19 restrictions imposed on both the Mexican and US operations interrupted the improving financial prospects.
The drop in the share price in the past three months coincides with the plan of the company to spin off the Nevadan Unit as a separate listed company, to be called Fortitude Gold Corporation (“Fortitude”), and a general sell-off in gold stocks across the board. Management believes the division of the company will create value for the shareholders for a number of reasons.
The primary reasons for the split were spelt out in an announcement on 5 October:
- Permit each company to focus on its own unique strategic business plan
- Allow each company flexibility to allocate resources and deploy capital in a manner consistent with its own business strategy
- Unlock a value premium for the Nevada Mining Unit due to its location in one of the world’s premier mining jurisdictions
- Allow each company to focus on streamlining each distinct operation – underground, hard rock operations in Mexico, and open-pit heap leach operations in Nevada, USA
- Two separate companies have the potential to provide investors with greater value than a single combined company
Crux Investor, however, disagrees with most of these reasons, principally because the Company had just regained critical mass and a mid-tier company with operational flexibility is much, much stronger than two single asset junior minor companies that run the risk of being capital-constrained. Still, the decision has been made, and investors have to look at the value proposition from the current position.
The poor share price performance since the split has, however, highlighted a number problem. The company holding the Nevadan unit will not qualify for a Main Board listing until it has sufficient operating track record so it is banished to the relative wilderness of an OTC listing. And as many of the institutional shareholders, which accounted for 45% of shares held just before the announcement, are forbidden to hold OTC listed shares, there has been a sharp sell-off.
With the spin-off targeted to be completed by the end of 2020 or the first quarter of 2021 and a dramatic sell-off already in the price, investors now have the opportunity to buy a value proposition today.
Historical Performance
Table 2_1 gives the historical operational and financial performance from 1 January 2010 until 30 September 2020 for Gold Resource Corporation.
The table shows that operationally:
- The milled throughput at the Mexican operation has been climbing consistently since 2011 until 2019 with the trend interrupted in 2020 due to the COVID-19 restrictions imposed on the company.
- Over the same period the precious metal grade has been dropping steadily by around half for gold and 76% for silver, but with base metal grades climbing, especially zinc. The operation has become increasingly a base metal producer.
- Revenue expressed as gold equivalent ounces sold peaked in 2013 when almost 0.83Moz were sold. In 2019 the gold equivalent revenue was below 2011 levels, the first full year of production.
- The contribution of base metal revenue to total gross revenue before transport charges increased from 11% to 57% in 2018, the year before the Nevada unit started contributing to revenue. By the end of 2018 the company’s name - Gold Resource Corporation - was a misnomer
- Through starting production in Nevada the company is reverting back to becoming predominantly a precious metal company.
The table shows that financially:
- Annual revenue between 2011 and 2018, the year before the Nevada operation started to contribute, averaged US$110 M with plant throughput increases substantially mitigating the drop in precious metal prices and drop in precious metal grades.
- The Mexican operation was a money spinner during the first three years of production allowing the company to return US$92 M cash to its shareholders, which is 1.7x the funds raised from shareholders in 2010.
- With sharply dropping precious metal grades and precious metal prices the company became first marginal cash positive net of investments during the period 2014-2017, and thereafter clearly cash negative, with development of the Nevadan operation creating an extra cash burden.
- GORO’s management takes great pride in consistently paying out dividends on a monthly basis since 2011, returning more than US$106 M by December 2016. Dividend payments thereafter are however more than covered by equity placements and must been seen as somewhat artificial. Over the last 2¾ years the company tapped the equity market for US$43 M support.
- The company seems to have turned financially during 2020 with net free cash flow from operations minus investments. What the table does not show is that the positive free cash flow of US$4.9 M for the nine months of 2020 is purely because of Q3 2020 performance which more than covered the negative US$7.5 M cash flow from operations minus investments for H1 2020.
The next sections will see whether the company can regain its status as a ‘real gold mine’.
Valuation Of The Oaxaca Mining Unit
Background
The technical information in his report has been mostly drawn from a technical report by GORO in support of an updated reserve estimation, effective 31 December 2019. Some reference was made to the report for reserves effective one year earlier. For certain illustrations reference was made to corporate presentations dated March 2018 and August 2020.
The Oaxaca Mining Unit comprises the Aguila Project and five other properties, which are 100% held by GORO.
The Oaxaca Mining Unit projects are located in the Sierra Madre del Sur Mountains of southern Mexico, in the central part of the State of Oaxaca (see Figure 3.1_1).
The projects are located along a major paved highway approximately 90 km to 120 km southeast of Oaxaca City, the state’s capital city. The nearest village to the Aquila project is San Jose de Gracia at 4 km to the southeast. A gravel and paved road has been constructed from the village to the mine and mill sites which supports access by small and large vehicles. The haulage distance by road from Alta Gracia mine section to the Aguila Plant, where the ore is processed, is approximately 32 km.
GORO currently holds an interest in 29 mining concessionsin Oaxaca State totalling 55,119 hectares. Figure 3.1_2 shows the outline andextent of the tenement area.
The Aguila area (rights located on the right, e.g. no. 1,2, 3, 27) has been secured through a lease agreement and is subject to a 4% netsmelter return (“NSR”) royalty where production is sold in the form ofgold/silver doré and 5% for production sold in concentrate form.
The rights to El Chacal (no. 4), El Pilon (no. 5) and theEl Rey (no. 21) mineral rights have also been obtained through an agreementwith a third party and are subject to a 2% royalty.
GORO has secured from the Mexican government additionalconcessions for the Oaxaca Mining Unit, referred to as El Pitayo 1 to 4, ElTalaje, El Coyote, El Zorrito, San Luis, La Curva, La Herradura, David Fracción1 and 2, El Chamizo, Zopi, San Miguel Fracción 2, El Aguila III, Correcaminosand Tlacuache that total an additional 45,029 hectares.
The Rey property area in the northwest of 2,335 hectaresincludes the El Rey rights plus additional rights obtained through claimstaking.
The San Pedro Fracción 1 (no. 25) and San Pedro Fracción2 (no. 26) concessions were acquired from Almaden Minerals Ltd. (“Almaden”) andare subject to a 2% net smelter return royalty.
The technical report only includes resources and reservesfor the Aguila project area (around the operating La Arista mine) shown on theeastern side of the map in Figure 3.1_2 and Alta Gracia in the centre. This note will therefore confine itself to discuss the deposits in these areas.
Geology and Mineralisation
The regional geology is dominated by multiple volcanic domes of various scales, and suspected non-vented intrusive domes, which are imposed on a pre-volcanic basement of sedimentary rocks. Gold, silver and base metal mineralisation in this district is related to this volcanogenic system. Mineral deposits are situated along a 55 km NW– SE mineralised trend, which is hosted by volcanic, sedimentary, igneous, and metamorphic rocks. The stratigraphy of the area ranges from older sedimentary rocks that have been intensely deformed by compressional forces to younger sub-aerial volcanic rocks, which have been affected by extensional deformation.
Figure 3.2_1 shows the geological map for the Aguila project area, extracted from the 2018 report, illustrating the close association of the deposits and exploration targets with fault structures.
An early structural direction oriented northwest - southeast is related to a compressional strike slip phase (see plan at the top of Figure 3.2_2), which were mineralised and which have later been displaced by strike slip structures oriented with a more northerly azimuth direction forces (see the clockwise shift of the direction of the thick arrows in the plan at the bottom).
The mineralisation is interpreted to be of an epithermal nature, which means that the deposits were formed near the surface, usually associated with hot springs and to depths in the order of a few hundred metres. The metal was dropped out of the circulating thermal waters when it reached a level where the hydrostatic pressure was low enough to allow boiling. The deposition therefore occurs under very specific temperature, pressure and chemistry conditions, and localised mineralisation manifests as high-grades over a relatively limited vertical extent. However, when repeated healing and reopening of host structures occur, vertical movement of the boiling zone can result in mineralisation that spans a much broader range of elevation.
The minimum and maximum elevations of the mineralised horizons at the Oaxaca Mining Unit have not yet been established, but current production spans a vertical elevation range of approximately 400 m, from 850 m down to 450 m elevation above mean sea level (“amsl”). The mineralised horizon has been extended by drilling another 250 m vertically, down to 200 m amsl.
The hydrothermal fluid can travel along discrete fractures creating vein deposits, or it can travel through permeable lithology, where it may deposit its metal load in a disseminated fashion. Overall, the style of mineralisation is pinch-and-swell on structure with some flexures resulting in closures and others generating wide sigmoidal breccia zones. Vein intersections are locally the site of important historic bonanzas.
Figure 3.2_3 show a schematic southwest-northeast cross section through the Arista and Switchback vein systems, which are in the northeast corner of Figure 3.2_1.
The economic mineralisation at the Arista Mine is gold, silver, copper, lead and zinc occurring in structurally-controlled veins and stockwork zones consisting of concentrations of sulphides. Underground production and exploration of the Arista vein has developed more than 600 m of ore grade mineralisation along strike on multiple levels.
In the Switchback area, 500 m northeast of Arista, mineralisation consisting of multiple sub-parallel veins and splays of varying length and width hosted in volcanic rock (brown in Figure 3.2_3) and associated with intrusive dykes (pink). To-date, seven major veins have been identified in drill holes: Soledad, Sofia, Selene, Silvia, Sabrina, Sagrario and Susana. The mineralisation occurs mainly as pyrite (FeS2) with varying amounts of sphalerite (ZnS), galena (PbS) and chalcopyrite (CuFeS2). Base metals occur here in at a somewhat higher concentration that at Arista.
Figure 3.2_4 shows the location of Switchback relative to Arista and how these were explored in the early stages by drilling from Arista.
The structurally-controlled epithermal veins andstockwork zones at Alta Gracia Project contain mainly silver-gold bearingsulphides without base metals.
Figure 3.2_5 shows the mineralised structures at AltaGracia, which here are narrow veins (<2 m) dominantly orientednortheast-southwest (red lines) and displaced later by northwest-southeaststructures (blue lines).
Mineral Resources and Reserves
Introduction
GORO, being a US listed company, used to follow Guide 7 of the Security and Exchange Commission (“SEC”) for declaring reserves. The procedure differs from technical codes elsewhere in the world by not separating as rigorously between resources and reserves. However on 31 October 2018 the SEC amended its disclosure requirement and included mineral resources as a reportable item, granting a two-year implementation period. GORO has decided to adopt the new rules for the 31 December 2019 reserve estimation.
Estimation of Mineral Resources
The database used for the resource estimation includes 91,164 drill holes for 85,591 m and 64,649 channel and trench samples for 60,072 m.
Wireframes were developed from cross sections oriented perpendicular to the overall trend of mineralisation. Where underground channel sampling is present, the channel samples were treated as a drillhole. The outlines of the wireframes were determined by the defined economic cut-off with demonstrated continuity between sections and include low-grade material where necessary to maintain continuity. A total of 43 individual wireframes were modelled for the Arista system, 27 for the Switchback system, and 14 for the Alta Gracia system. The derived wireframes were used for rock coding, statistical analysis and compositing limits.
Figure 3.3.2_1 shows a plan view and cross section of the wireframes for Arista and Switchback.
Figure 3.3.2_2 contains a 3-dimensional view of the wireframes for Alta Gracia.
Generally, the model blocks are fixed in size at 1.0 m vertically and 1.0 m horizontally, parallel to the average strike of the vein system. Perpendicular to strike the thickness is determined by the actual width of the individual vein, and block resolution was set to 0.1 metre in the cross-strike direction.
Individual block grades were then used to calculate an NSR and a gold equivalent block model assuming metal prices of.
For the Arista and Switchback vein systems, mineralised zones were defined based on a nominal drill-hole intercept of a composited 1.5 m of assay length that had a minimum average net smelter return (“NSR”) value above US$76 per tonne using three-year trailing average prices for gold, silver, copper, lead and zinc (i.e. US$1,306/oz Au, US$16.32/ oz Ag, US$2.83/lb Cu, US$0.99/lb Pb and US$1.27/lb Zn). For the Alta Gracia vein system, mineralised zones were defined based on a composited drill hole intercept that had a minimum gold-equivalent grade of 2.5 g/t.
Spatial grade continuity and grade trends were modelled using the overall best fit strike and dip of the individual vein. The modelled continuity was used to define the overall orientation of the search ellipsoid for each individual vein. Anisotropic inverse distance cubed (“ID3”) linear weighting of capped composite values was used for the estimation of Au and Ag block grades. For the estimation of Cu, Pb and Zn block grades anisotropic inverse distance squared (“ID2”) linear weighting of capped composite values was used.
Table 3.3.2_1 summarises the mineral resources as at 31 December 2019.
The numbers in the table illustrate the higher base metalconcentrations at Switchback compared to Arista. This probably reflects a metalzonation with higher precious metals closer to surface (especially consideringthe much higher metal grades at Arista in the early years) and increasing basemetal grade with depth. Arista and Switchback are clearly the most importantdeposit areas, each contribution approximately equally to total resources.
Estimation of Mineral Reserves
The mineral reserves estimation is based on currently employed underground mining methods with the following dilution and mining recovery factors:
The table shown above contains numbers from GORO public documents. Crux Investor, however, fails to see how the average mining recovery is 84% (too low) and the average dilution is 26% (too high) relate to the individual values. Crux Investor has made minor adjustments to the dilution and mining recoveries in its modelling. Total dilution is the results of planned dilution (designing to a minimum mining width), unplanned dilution (mining beyond design) and loading dilution (scraping 0.1 m of the floor). For planned dilution a minimum operational width of 1.5 m has been assumed for Longhole Open Stoping, 1.8 m for Shrinkage mining and 2.5 m for Cut & Fill mining. The overbreak (= unplanned dilution) assumed for these methods is respectively 0.4 m, 0.2 m and 0.6 m. Development drifting is at 3 m width with an assumed overbreak of 0.5 m.
Due to the very high contribution of base metals to revenue GORO has started to use NSR-value including off-take terms and off-mine charges to determine the value of each block in order to decide whether it is part of reserves or not, by applying a cut-off value of US$76 per diluted tonne. For Alta Gracia a gold equivalent cut-off grade of 2.5 g/t has been used.
Table 3.3.3_1 shows the NSR and Au equivalent multiplier values used for breakeven cut-off grade calculations.
The table indicates that one gram of silver contributesUS$0.32 to the NSR and that 80.03 grams are required at Alta Gracia to equalone gram gold content.
GORO claims the cut-off grade of US$76/t NSR is based onactual average cash operating cost for the 12-month period for the year ending31 December 2019, reproduced in Table 3.3.3_2, but also accounting for off-taketerms, royalties and metallurgical recoveries.
The breakeven NSR cut-off grade is applied to theestimated Proven and Probable reserve blocks, and those that exceed thebreakeven NSR cut-off grade are considered for inclusion in the mine plan andfor reporting as reserves.
The vein solids (= three dimensional shapes in the modelof the mine) are cut into benches and drifts and then subdivided into selectivemining units (“SMU’s”), which are usually 15 m along the strike direction ofthe vein. Typically, especially in new mining areas, heights are 4 m high fordrifts and 16 m high for benches.
Figure 3.3.3_1 shows an example of a vein divided into SMU’s.
In preparation to reporting reserves blocks that have been mined out are removed, blocks that are accessible using current mining practices are identified and solids of satellite bodies discarded that are too far from the primary infrastructure and do not warrant the investment to access them.
An infrastructure filter is also undertaken. This mainly consists of discarding any SMU solids of satellite bodies, which are too far from the primary infrastructure and development to make accessing them economically justifiable.
Table 3.3.3_3 gives the reserve statement, effective 31 December 2019.
Comparison between the Resources table (3.3.3_2) and the Reserves table (3.3.3_3) shows that just over half of the precious metal contained in M&I resources at Arista and Switchback is converted to reserves at a grade that is higher for all metals, in particular for silver and copper, despite considerable dilution. The higher grades in the reserve figures is probably an effect of more conservative input parameters being used when compared to the parameters used for resource estimation.
When reviewing the reserves per structure it is evident that of the 43 structures contributing (22 at Arista, 14 at Switchback, and 7 at Alta Gracia) the 10 largest deposits account for more than 78% of the gold content and more than 74% of the silver content. Of these ten deposits Switchback has three and Alta Gracia none. By far the biggest deposit is Soledad at Switchback, which contains 43% of all gold and one third of all silver.
Mineralised Material
Despite GORO having adopted the new reporting regulations its 2019 reserve estimation reports still reports “mineralized material” as per the old regulations, defined as “a mineralized body that has been delineated by appropriate drilling and/or underground sampling to establish continuity and support an estimate of tonnage and an average grade of the selected metal(s)”. In addition it also reports Mineral
Resources which “do not qualify as Mineral Reserves nor Mineralised Material”.
GORO management is obviously still struggling to make the jump from the old method to the new method of resource classification. GORO has defined Mineral Resources at a cut-off grade of US$76/t, but the proportion without demonstrated economic viability was not converted to Mineral Reserves. The unconverted portion is therefore the same as Mineralised Material. This report has ignored the numbers reported for Mineralised Material.
Just to clarify, there are three types of classification here: Mineralised Material, Mineral Resources and Mineral Reserves.
Mineralised Material does not have an economic cut-off applied to it, but it has been drilled out so that estimates of grade / tonnes can be made. This old-fashioned classification is being phased out as it does not fit in with US regulations (or indeed with NI 43-101 or JORC standards). Nowadays it is not enough to know that mineralised material exists to qualify as a resource, it has to be reported within a set of economic assumptions and controls.
Resources and Reserves, of course, have economic parameters included in the calculation, with Reserves under tighter control, further de-risked, than Resources.
Although having made the conversion to the new system of Reserves and Resources, GORO still includes estimates of Mineralised Material. Perhaps this is to show the geological continuity of the orebody, and to provide comfort that a conversion to Resources and thence to Reserves is possible in the future? Whatever the reason, it is a minor quibble, and for want of much else to complain about, Crux Investor will call it a Red Flag.
Production Reconciliation
The company includes the findings of a reconciliation exercise carried out using production statistics in 2019. Table 3.3.5_1 shows the results of reconciliation of actual production against planned production.
The light-grey highlighted cells show a very material difference between actual grade mined and planned grade, particularly for gold, and much lower actual blasted tonnage, which according to GORO management could indicate an over-projection of higher grades into sparsely drilled areas. The explanation is however not entirely satisfactory as the difference for gold is much higher than for the other metals. In addition, it fails to explain the difference between planned tonnage production and actual tonnes shipped.
The dark-grey highlighted cells show a difference in the amounts processed (treated) and the amounts mined (shipped). The explanation is that 21,822 tonnes were stockpiled for treatment in 2020, but in turn this raises the question as to whether there was any stockpiling 2018 to 2019. The treated grade consistently exceeds the grade predicted by grade control measures. GORO does however ignore this as being within 10% and therefore acceptable.
The overall discrepancy between processed and planned production is material for tonnage and gold and zinc grade (see light-purple highlighted cells).
Mining Operations
The latest technical report is a much-abbreviated version of the report two years older and basically ignores properly discussing mining and processing. For this reason reference was made to 2018 technical report with the December 2017 reserve estimation.
The Primary access to the Arista mine is via a haulage decline ramp with its portal at the exhausted Aire Creek open pit at 902 metres above mean sea level (“amsl”). The decline has a minus 10% gradient and had reached by 31 December 2017 the 27 Level for a total length of 4,200 m.
Current underground mine planning and exploitation is based on a typical vertical separation of mine levels of approximately 18 m.
Figure 3.4_1 shows an isometric view of the main underground infrastructure at Arista mine.
The main mining methods used at Arista are longhole open stoping (“LHOS”), mechanised cut and fill (“MCF”) and shrinkage (“SH”). Apart from mentioning that LHOS is the preferred method where conditions allow, GORO does not give details about the proportional contribution of each method to production.
Processing Operations
The plant consists of two main process flows: a flotation plant for concentrating base metal sulphides and an agitated leaching plant for treating precious metal material with little base metals.
The flow sheet for the flotation plant includes two stages of crushing to -95 mm, subsequently milled to 55% passing (P55) 74 μm, which is then sent to the flotation circuits where first a copper rougher concentrate is produced, then a lead rougher concentrate and finally a rougher zinc concentrate. Each of the rougher concentrate is then cleaned by further flotation. The tailings of the lead cleaning flotation cells are combined with the zinc rougher concentrate for treatment in the zinc cleaning flotation cells. To improve gold recovery a Knelson gravity concentrator has been added in 2013 to the comminution section.
Water is removed from each concentrate by press filters.
The agitated leach plant has its own grinding circuit and uses zinc to precipitate gold (in the industry referred to as the Merrill Crow process) with the sludge sent for melting to doré.
In 2019 the metallurgical recoveries were 78% for gold, 90% for silver, 78% for copper, 78% for lead and 81% for zinc. With a drop in precious metal grades the recoveries have deteriorated. Silver recovery was 92% in 2016 when the feed grade was 139 g/t, and gold recovery was 90% in 2016 when the feed grade was 2.13 g/t Au.
Economic Valuation – Oaxaca Mining Unit
Introduction
Whereas the GORO makes a big issue in its technical report of the definition “mineral reserves” requiring establishing these to be economically mineable, it does not provide the information and cash flow modelling to prove such. Crux Investor feels that the economic assumptions should be made public so that analysts can judge for themselves whether companies are making valid assumptions based on benchmark figures and hard-won experience. Nevertheless, the stock exchanges allow operating companies to run with private ‘economic assumptions’. Never fear, Crux Investor has used broad assumptions based on cost information, decades of experience, and benchmark figures to fill in the gaps and thereby draw up a cash flow model.
Metal Prices Assumed and Offtake Terms
For the Base Case of this valuation, the spot prices on 30 November 2020, US$1,777/oz Au, US$22.65/oz Ag, US$3.46/lb Cu, US$0.94/lb Pb and US$1.26/lb Zn were used to determine the value of the discounted cash flow.
As a short cut to calculate the at-mine revenue the average payabilities for each metal as reported by GORO for the 2½ years up to H1 2020 have been used instead of calculating the concentrate values. Without sufficient information on process flow, mass pull and recoveries a first principle calculation is not possible.
The off-mine charges for transport, treatment and refining has been derived as the difference between total revenue received derived from payable metal multiplied by realised prices minus the reported revenue for the mining unit. Expressed per tonne milled the rate varies greatly between years. In the early years this was approx. US$50/t dropping to as low as US$9.1/t in 2018 and since rising again to US$25/t in the first nine months of 2020. For this valuation a rate of US$30/t has been assumed.
Production Schedule
The technical report being without a production schedule, this valuation had to draw up a speculative schedule assuming that twice the 31 December 2019 reserves will eventually be mined.
Table 3.6.3_1 shows the declared reserves over time for the Arista mine complex to illustrate GORO has successfully replenished and even increased its reserves over time, levelling off in the last two years.
The declared reserves are sufficient to support mining until early 2024 at a plant throughput rate of 0.6 Mtpa from 1 January 2021 onwards. By assuming the company will be successful replenishing existing reserves one time over mine closure would occur early in 2029.
Grades have assumed to be equal to the 31 December 2019 reserve grades.
In the corporate presentation dated August 2020 slides are included by GORO management to demonstrate the potential for replacement of resources, especially at Switchback and a “third parallel system” (refer to Figure 3.6.3_1).
The third parallel vein system is based on an exploration model indicating vein systems are present in parallel NW-SE zones within a structural corridor that trends NE-SW (see Figure 3.6.3_2).
According to a slide the vein systems express themselvesas ridges on surface, which should give extra confidence about the validity ofthe model.
On the plan an underground exploration drive is indicatedin green which will serve as drill platform to test the northwest continuationof the Switchback system and the possibility of a parallel system to thenortheast. Not shown, but indicated on another slide is a similar explorationdrive developed to the south east at Switchback.
In the light of the exploration potential highlightedabove, including double the 2019 reserves in a production schedule is notunreasonable.
Operating Expenditure
Table 3.6.4_1 gives the breakdown of cash cost as per2017 reserve estimation and compares this with the total cash cost as per audited annual financial statements for 2017, confirming that the two reconcile well.
The latest technical report does not give such a breakdown and does not really substantiate the decline in unit operating cost rates for mining, processing and G&A used for the mineral reserve cut-off grade estimation. This valuation has therefore assumed a similar cost structure as for 2017.
Capital Expenditure
The technical report also does not provide information on capital expenditure required in future, not even the investment required for 2020. For this reason reference was made for capital expenditure in the 2017 reserve estimation report , which has been reproduced in Table 3.6.5_1, compared to actually reported expenditure in the subsequent years.
The sustaining capital expenditure in 2017 as per the technical report does not reconcile with the number reported in the annual financial statement for that year. Crux Investor could not establish the reason for this discrepancy. Whereas sustaining capital expenditure has dropped since 2017, total capital expenditure has been not that different, which could point to a reclassification of certain items to “growth” capital expenditure.
This valuation’s cash flow model assumes capital expenditure remaining at 2019 levels, but declining three years before mine closure to two thirds of 2017 level, half in the year before closure and nil in the last production year.
The closure and rehabilitation cost have been estimated at US$3.5 M according to the 2017 reserve estimation report.
Working Capital
This valuation assumes that the mine is currently fully funded in terms of net current assets. No adjustments for working capital at the end of life have been made as Enterprise Value figures adjust for working capital.
Royalties and Taxes
The lease agreement for the Aquila area is subject to a 4% NSR royalty where production is sold in the form of gold/silver doré and 5% for production sold in concentrate.
The Mexican tax regulations include:
- An “environmental protection fee” of 0.5% on gross revenue from precious metals.
- A “Special Mining Tax” at 7.5% of the Earnings Before Interest, Taxes, Depreciation and Amortisation (EBITDA). This charge is deductible for income tax purposes
- Change from accelerated amortisation of pre-production investment to a 10% rate on a straight line basis, but allowing for accelerated depreciation when the LOM is shorter, resulting in full depreciation upon mine closure.
- The income taxes are currently 30%.
- Tax on expatriation of dividends a 10%, but according to GORO in terms of existing US-Mexico tax treaty the applicable rate to the company is 5%.
The technical report and financial statements do not identify the balance allowed for tax depreciation and this valuation has generated a schedule using the balance for Property, Plant and Equipment at 2011, just after start of production and annual capital expenditure at the Oaxaca Unit calculate tax allowances claimed assuming 10% per annum. This underestimates the allowances claimed in the early years when accelerated depreciation was allowed in terms of Mexican tax regulations, but this introduces only a minor optimistic bias as early capital expenditure was minor compared to current outlays.
Results
Table 3.6.8_1 summarises the LOM results for Base Case metal prices and the input parameters set out above for the period 1 January 2021 onwards assuming only the 31 December 2019 reserves will be depleted and twice this amount will eventually become available.
The operating cash margin for both scenarios is justbelow 52%, which is very good for a mature mine. However, Mexican taxregulations impose a high burden absorbing approximately 29% of the EBITDA forboth scenarios. Being an underground mine, the longer LOM scenario absorbsanother 19% of EBITDA for capital expenditure leaving almost 51% of EBITDA fordistribution to shareholders. This increases to more than 56% for the shorterLOM as capital expenditure drops off as the mine nears closure.
The net present value at a discount rate of 5% (“NPV5”)for the shorter LOM is US$164 M which increases to US$292 M should the longerLOM be achieved. Every additional year of production adds approximately US$35 Mto NPV5.
Table 3.6.8_2 explores the sensitivity of the net present values to change in the metal prices and cash operating cost for the longer LOM scenario.
The high margin nature of Arista makes the results relatively insensitive to changes in metal prices with NPV’s changing by 2.3%for every percentage point change in these prices and by 0.8% for every percentage point change in cash operating cost. To double the NPV5 value an across the board metal price rise of 44% from current levels is required.
Valuation of the Nevada Mining Unit
Background
The technical information in his report has been mostly drawn from a technical report by GORO dated 16 February 2020 in support of an updated reserve estimation for the Isabella Pearl deposit, effective 31 December 2019. For certain illustrations reference was made to a corporate presentation dated August 2020.
The Isabella Pearl mine is located in the Gabbs Valley Range, approximately 10 km north of the town of Luning in Mineral County, Nevada. (see Figure 4.1_1).
The mine site is reached from Hawthorne travelling 40 km on US Highway 95 until Nevada State Route 361 just west from the town of Luning. The mine site is at a road distance of 10 km, first north along Route 361 then west using a dirt road.
The mine area covers approximately 198 hectares and consists of 42 unpatented lode mining claims on land owned by the U.S. government, and administered by the Bureau of Land Management (“BLM”).
Figure 4.1_2 shows the outline and extent of the tenement area with the thick black outline identifying the mine boundary.
There are ten claim areas in the extreme northwest corner which are owned 100% by GORO, 50% outright and the balance secured through a lease in terms of which there is a 3% NSR royalty payable on revenue derived from these claims. The balance of the rights is subject to a 3% NSR royalty in favour of Gateway Gold (USA) Corporation (“Gateway”), which covers the three claims designated TDG1-TDG3 and TXAU Investments Limited (TXAU”).
GORO also controls an additional 454 claims covering approximately 3,240 hectares along a nearly 30 km trend extending northwest of the Isabella Pearl mine covering a number of prospects.
Geology and Mineralisation
The Isabella Pearl mine is located in the central portion of the Walker Lane, a major northwest- trending zone on the western border of Nevada characterised by a series of closely spaced faults. Walker Lane is a complex zone up to 100 km wide and 700-900 km long.
Figure 4.2_1 shows the geological map for the mining area with the same mine boundary outline as in Figure 4.1_2 superimposed and identifying the most important fault structures: the Soda Spring Valley fault in dark blue, the Pearl Scarlet fault in red, the Civit Cat Fault in green, the Pyrite Spring fault in light blue and the Copper Cliff fault in orange.
According to the technical report, many more faults are present than shown on the map, but individual faults and related fractures and joints are so numerous, and commonly obscured by alteration, that only the principal ones have been mapped.
The fault structures are of major importance in controlling the localisation of mineralisation by creating the conduits along which the mineralising fluids could travel. A second control for mineralisation is lithology with favourable rock types causing precipitation of gold by chemically reacting to the acid gold bearing fluids.
Figure 4.2_2 shows an idealised section showing the mineralisation controls for both the lithologically controlled Isabella deposit and the structurally controlled Pearl deposit.
The deeper deposits are relatively high-grade because these environments were the first favourable environments encountered by ascending, mineralising hydrothermal fluids.
Figure 4.2_3 shows two cross sections through Isabella (top) and Pearl (bottom) after the area had been affected by post mineralisation deformation.
The cross sections show that the Isabella mineralisation is substantially above the oxide-sulphide boundary, whereas a substantial portion of the higher-grade Pearl deposit is below the oxide-sulphide boundary. For the heap leaching processing method it is important the mineralisation has been oxidised to liberate the gold and make it amenable to cyanide leaching.
Mineral Resources and Reserves
Estimation of Mineral Resources
The final mine database includes a total of 379 holesdrilled by Combined Metals- Homestake, TXAU and GORO at Isabella Pearl through2019, including 339 reverse circulation (“RC”), 33 diamond drill holes (“DDH”)and three metallurgical DDH drill holes and four water wells.
Figure 4.3.1_1 shows the drill hole collar location mapfor Isabella Pearl.
According to the technical report, many more faults are present than shown on the map, but individual faults and related fractures and joints are so numerous, and commonly obscured by alteration, that only the principal ones have been mapped.
The fault structures are of major importance in controlling the localisation of mineralisation by creating the conduits along which the mineralising fluids could travel. A second control for mineralisation is lithology with favourable rock types causing precipitation of gold by chemically reacting to the acid gold bearing fluids.
Figure 4.2_2 shows an idealised section showing the mineralisation controls for both the lithologically controlled Isabella deposit and the structurally controlled Pearl deposit.
The deeper deposits are relatively high-grade because these environments were the first favourable environments encountered by ascending, mineralising hydrothermal fluids.
Figure 4.2_3 shows two cross sections through Isabella(top) and Pearl (bottom) after the area had been affected by postmineralisation deformation.
The cross sections show that the Isabella mineralisation is substantially above the oxide-sulphide boundary, whereas a substantial portion of the higher-grade Pearl deposit is below the oxide-sulphide boundary. For the heap leaching processing method it is important the mineralisation has been oxidised to liberate the gold and make it amenable to cyanide leaching.
Mineral Resources and Reserves
Estimation of Mineral Resources
The final mine database includes a total of 379 holes drilled by Combined Metals- Homestake, TXAU and GORO at Isabella Pearl through 2019, including 339 reverse circulation (“RC”), 33 diamond drill holes (“DDH”) and three metallurgical DDH drill holes and four water wells.
Figure 4.3.1_1 shows the drill hole collar location map for Isabella Pearl.
The Isabella, Pearl, Scarlet South and Civit Cat Northdomains were modelled based on a nominal 0.30 g/t Au grade threshold. In orderto maintain continuity lower grade assay intervals were incorporated into themodelled domains where found to be appropriate. Wireframes were generated forthese domains, the result of which shown in Figure 4.3.1_2.
Pearl is shown in red, Isabella in blue, Civit Cat North in green and Scarlet South in brown.
The gold grade statistics for the various deposits show moderate coefficient of variation (“CV” = standard deviation / mean) values with 0.99 for Civit Cat North, 1.47 for Isabella, 1.81 for the Pear Main zone and 2.29 or Pearl Vein. To limit the impact of outlier high composite grades these were capped at 10 g/t for Isabella and Pearl veins, 50 g/t for Pearl Main structure and 4 g/t for Civit Cat North. This should have brought the CV values further down, but the technical report gives no details. For the Pearl deposit an additional range restriction of 40 m was placed on composites equal to or greater than 50% of the capping threshold.
For grade estimation a block size of 5 m x 5 m x 6 m was selected, which is considered representative of the selective mining unt (“SMU”). Estimation methods used were Inverse distance cubed (“ID3”), ordinary kriging (“OK”) and Nearest Neighbour (“NN”) weighting of capped composite values. The main search directions are parallel to the strike and dip of the deposits.
Figure 4.3.1_3 shows a typical cross section looking northwest through the gold block model.
The conceptual pit outline for reporting resources that are potentially economic assumes a gold price of US$1,306/oz, a 3% royalty, a recovery of 81% from crushed material, mining cost of between US$2.76/t and US$2.99/t depending on the type of material, processing cost of US$9.26/t and G&A of US$5.26/t for a cut-off grade of 0.44 g/t Au.
The bottom of the pit shell has not been taken below the water table and all sulphide mineralisation not amenable to heap leaching has been treated as waste.
Table 4.3.1_1 summarises the mineral resources as at 31 December 2019.
Estimation of Mineral Reserves
For the estimation of mineral reserves conventional open pit mining and heap leach processing was assumed. The same economic input parameters were used as for the resource estimation.
GORO assumes that the dilution created by including waste in the SMU of 5 m x 5 m x 6 m adequately accounts for total dilution. It therefore ignores dilution caused from mixing blasted or from defined ore and waste blocks. This is somewhat optimistic but given the width of the deposits compared to block size (refer to Figure 4.3.1_3) not serious as relatively few blocks are bordering waste.
GORO makes much of the cut-off grade applicable for the various mineralisation types and process routes (i.e. leaching of uncrushed versus crushed ore) taken, but this is actually irrelevant as is evident from the diagram in Figure 4.3.1_4.
The axes have purposefully been taken to nil to highlight the very insensitive nature of the relationship with a change on cut-off grade from 0.5 g/t to 0.6 g/t Au (i.e. 20%) resulting in a drop of 1.8% in gold content. The insensitivity of the relationship is not surprising given the fact that the grades are high relative to the low operating costs of a heap leach deposit. At such a high grade and the very low operating cost the cut-off grade will be very low. The discussion of whether
to leach crushed or uncrushed is usually a short discussion as every percentage point of recovered gold is so valuable, especially at current gold prices. The gain in recovered gold typically outweighs the extra cost of crushing the ore.
Table 4.3.2_1 gives the reserve statement effective at 31 December 2019, which is exactly the same as the resource statement, thereby assuming a 100% conversion rate.
GORO chooses not to disclose the strip ratio (the ratio of waste to ore tonnes in an open pit development) as part of the reserve statement. However under the discussion of Mining Methods it is mentioned that the pits will generate 15.8 M tonnes of waste for a strip ratio of 7.0:1
However the strip ratio mentioned under the discussion of the Isabella Pearl project on the website is 5:1, implying 11.24 Mt of waste required to be stripped. This valuation has conservatively modelled the higher number.
Mining Operations
The Isabella Pearl operation consists of one pit accessing the Isabella, Pearl and Civit Cat North deposits. Open pit mining is conducted by a contractor using conventional diesel-powered equipment of blasthole drills, wheel loaders, and 91-tonne trucks. Mining is with 6 m high benches and at an inter-ramp slope of almost 50 degrees.
Grade control uses blasthole samples to classify the material as high-grade (>0.61 g/t Au), low-grade (between 0.44 g/t and 0.61 g/t Au) and waste. Higher-grade ore is crushed before being placed on the leach pad by a stacker conveyor system and low- grade ore is hauled to a stockpile for later processing. Waste rock is stored in the waste rock facility located in close proximity to the pit.
Processing Operations
Metallurgical Testwork
Before GORO became involved the Isabella Pearl mineralisation had been subjected to nine separate programmes of metallurgical test work, the most relevant being by the Combined Metals-Homestake joint venture undertaken in 1990, and by TXAU in 2009, which focused on heap leaching as process route. Oher programmes looked at other processing methods. The results showed the material to be very amenable to heap leaching with recoveries between 64% and 89% for a particle size coarser than 1 cm.
Mineralogical examination showed that the gold In the Isabella deposit occurs as very small (<10 μm) liberated particles in cavities and along fracture surfaces and iron oxide minerals jarosite, limonite and goethite. At Pearl the gold is contained both as locked and free particles, as native and electrum in an average size of 14 μm, again associated with iron oxides, but also psilomelane (a barium manganese oxide).
GORO carried out follow-up column leach testwork in 2016-17 including tests of agglomerated material. At a crush size of 1.6 cm (5/8 inch) recovery was found to be fast and high with 76% for 0.74 g/t Au feed grade and 89% for 9.3 g/t Au.
Based on the metallurgical test work completed, recoveries are estimated at 81% for crushed ore after 4 months leaching, half of which takes place in the first month. For uncrushed ore this is estimated at 60% of which one third is recovered in the first month. Given the very large difference in recovery, GORO should not even consider not crushing its ore as it would simply leave too much money in the heap.
Cyanide consumption was expected to average 0.75 kg/t and lime 3.0 kg/t. As cyanide consumption is a function of gold grade and this grade being exceptionally high for a heap leach process, this rate is very low when compared to a heap leach operation treating 0.4 g/t Au, say. Processing.
Based on metallurgical testwork it was decided heap leaching was the most economical process route including crushing, followed by absorption/desorption recovery of the gold and melting to doré bars.
Isabella Pearl high-grade ore above the 0.61 g/t Au cut-off is crushed using a two-stage portable crushing plant to a particle size
High-grade ore is first trucked from the open pit to a stockpile located close to the primary crushing circuit. A front-end loader then feeds the high-grade ore to the crushing circuit where a stationary grizzly prevents oversized material (no detail given on what cut size is used) from making its way into the crusher cavity. The primary jaw crusher reduces the material to 80% passing (“P80”) 8 cm and fed to a secondary crusher to achieve the target particle size of P80 1.6 cm (5/8 inch). This is conveyed to the heap after adding lime at the first conveyor section.
A cyanide solution is emitted using drippers. This solution dissolves gold on its way down through the heap until it reaches the bottom where a plastic liner prevents further downward flow. The pregnant liquor is collected by 20.3 cm high-density polyethylene (“HDPE”) piping resting on the upper geomembrane, the solution flows by gravity to solid 25.4 cm HDPE outlet pipes and exits each side of the leach pad to flow to pregnant solution pond. From there it is pumped to a carbon-in-column circuit where activated carbon extracts the gold from solution. The carbon is then “stripped” from its gold by washing it with a cyanide rich solution and the gold precipitated electrolytically with the sludge melted with fluxes to generate a precious metal rich product that can be poured as doré bars.
Economic Valuation – Isabella Pearl Mine
Metal Prices Assumed and Offtake Terms
For the Base Case of this valuation, the spot prices on 30 November 2020, US$1,777/oz Au, and US$22.65/oz Ag.
For refining charges reference was made to the input-parameters for resource and reserve estimation which give a rate of 0.075% of gross revenue
Production Schedule
As the GORO technical report again does not provide a production schedule, this valuation had to draw up a speculative schedule assuming that the 31 December 2019 reserves depleted until 30 September 2020 will be depleted in Q4 of 2020 at the same rate as for Q3 2020. This valuation has only used production from January 2021 onwards.
Table 4.6.2_1 shows how the production schedule was derived taking into account estimated 2020 production and crushing at a rate of 0.70 Mtpa, which is as originally planned by Gold Resource, but is somewhat below the actual Q3 2020 crushing rate of 0.75 Mtpa.
The cells highlighted light-grey contain educated guesses for grade (i.e. forecast in Q4 2020 is 40% higher than the mined Q3 2020 grade), strip ratio and additions to the stockpile. It should be noted by assuming treatment of the remaining reserve grade at start of 2021 for the year, the calculated gold production of 68,791 oz far exceeds guidance of 40,000 oz. This maybe too high, but it reduces the calculated gold production in the subsequent years. There is much uncertainty about the individual numbers, but over the short LOM these are not critical to the overall value.
Without a production schedule with silver grades, the amount of silver produced has been assumed equal to the ratio of actual silver produced over actual gold produced in 2020 which was 120%.
In Section 4.1 it was mentioned that GORO also controls an additional 454 claims covering approximately 3,240 hectares along a nearly 30 km trend extending northwest of the Isabella Pearl mine covering a number of prospects. The corporate presentation dated August 2020 includes a number of slides about the potential for finding additional resources. These can be classified as near-mine and more distant prospects. Figure 4.6.2_1 reproduces a slide with prospects near the current operation along a 10 km long corridor.
Drilling in the immediate vicinity of Isabella Pearl have encountered mineralisation over tens of metres with grades exceeding 1 g/t Au. There is however yet not sufficient information on whether these results define a consistent deposit.
Apart from the near-mine targets, the company also controls ground further away over 4 other promising targets. Figure 4.6.2_2 contains another reproduction of a slide with the location of these targets relative to Isabella Pearl.
Whereas the text on the slides includes “close proximities”, this should be taken with a pinch of salt as the closest is more than 23 km away in a straight-line. When dealing with material that needs crushing only before being leached it does not make sense to haul to the Isabella Pearl operation as the cost will quickly exceed crushing cost savings. Where the Isabella Pearl operation could give an advantage in easier permitting using existing facilities.
As there is too much uncertainty relating to exploration success, this valuation only contains the depletion of known reserves in its production schedule.
Operating and Capital Expenditure
Without guidance on operating costs this valuation has adopted the cost rates used for establishing the cut-off grade for resource and reserve estimation: US$2.80/t mined, US$9.0/t processed and US$5.26/t G&A, which amounts to US$3.4 M per annum. These are relatively high rates for the USA and should be considered conservative.
Actual sustaining capital expenditure has been low, and this valuation has ignored this for the future. In practice the company will spend considerable amounts on exploration to replenish resources, but this has been ignored as potential success from this has also been ignored as too uncertain.
Working Capital
This valuation assumes that the mine is currently fully funded in terms of net current assets. No adjustments for working capital at the end of life have been made as Enterprise Value figures adjust for working capital.
Royalties and Taxes
USA taxation is notoriously complex and the PEA report gives no details to shed light on the matter. For this reason, this valuation has also referred to two publications:
- Understanding Nevada’s Net Proceeds of Mineral Tax, 2007-2008 edition, Nevada Tax Payers Association.
- A 2012 slide presentation by PWC at the American School of Mines entitled Basics of U.S. Mining Taxation and a note by PWC with the title Corporate Income Taxes, Mining Royalties and Other Mining Taxes; A Summary of Rates and Rules in Selected Countries, dated June 2012.
Applicable taxes for mining companies in Nevada are:
- As from 1 January 2018 Federal Income Tax at 21.0%.
- Nevada Net Proceeds Tax sliding scale up to 5.0%.
The base of the Net Proceeds Tax is attributable at-mine revenue minus depreciation of the cost of machinery and equipment. Where the net proceeds of the mine are less than US$4 M, the tax rate is a function of margin, where it exceeds US$4 M, it is 5%.
The tax base for Federal Income Tax is calculated as revenue less allowable costs (presumably operating costs), Nevada Net Proceeds Tax, depreciation and the greater of cost depletion or percentage depletion. According to the PWC note on rates, a depreciation rate of 14.3% is applicable on mining investments. This has been applied to sustainable capital expenditure.
The calculation of the depletion allowance is a typical example of the overly complex US tax system.
The greater of cost depletion and percentage depletion is allowed with:
- For Cost Depletion there are three different methods, the simplest of all being a write down of the pre-production capital investment at 10% per annum.
- Percentage Depletion is the lower of a specified percentage of net metal revenue (revenue minus royalties) and 50% of net taxable income before depletion. The “specified percentages” for gold and silver is 15%.
From the documentation it seems that Percentage Depletion can be deducted annually also after recoupment of the initial capital expenditure.
Losses in a given year may be carried back two years and carried forward for 20 years, except losses incurred as a result of the reclamation costs, which may be carried back 10 years.
The technical report gives no detail on available tax-deductible balances.
Being a very high margin operation this valuation has applied 5% Nevada Net Proceeds Tax.
Results
Table 4.6.6_1 summarises the LOM results for Base Case metal prices and the input parameters set out above for the period 1 January 2021 onwards assuming only the 31 December 2019 reserves will be depleted and GORO not being able to replenish these through further exploration.
The operating cash margin is almost 74%, which is phenomenally high explained by the very high-grade nature of the reserves, the very high metallurgical recovery for a heap leaching process and the low-cost nature of the process route. The much higher margin than achieved in H1 2020 is due to ore from the Pearl deposit starting to complement in future the much lower grade Isabella ore.
The low tax burden in the USA combined with no capital expenditure results in almost 80% of EBITDA becoming available for distribution to GORO.
The net present value at a discount rate of 5% (“NPV5”) is US$151 M. Every additional year of production adds approximately US$70 M to NPV5, assuming this is at the same average grade. Whether additional discoveries will be at the same grade as current reserves is however very questionable.
Given the very high margin of the current project, it serves little purpose to carry out a sensitivity analysis.
Valuation of Gold Resources Corporation
Valuation of Consolidated Cash Flow
The valuations of the Mexican and Nevadan operations have not accounted for cash outflows at corporate level. These involve mostly corporate general and administrative expenses of approx. US$9 M per annum in cash (without stock-based compensation) and US$4 M for exploration. As it would be too onerous to account for exploration expenses without considering any value derived from success, this item has been ignored as unquantifiable. Figure 5.1.1_1 shows the annual cash flow at corporate level from the mining operation and impact of corporate overheads.
The diagram shows an amazingly high cash flow from the operations in 2021 compared to the first nine months of 2020 performance when cash flow from operations minus investments was US$4.9 M. This is explained by:
- The Arista mine assumed not being affected by any further shut downs
- The metal prices modelled at 30 November spot prices which are for gold 1% higher than realised in 2020 year to date, 13% higher for Ag, 28% higher for Cu, 17% for Pb and 31% higher for Zn. \Nevada having reached full ramp up and producing almost 70,000 oz Au compared to an annualised 22,300 oz in the first nine months of 2020.
- Nevada having reached full ramp up and producing almost 70,000 oz Au compared to an annualised 22,300 oz in the first nine months of 2020.
In practice the cash generation will be somewhat lower than shown on the diagram because for outlays on exploration, but with a much longer The NPV5 value of the corporate cash flow is US$391 M.
The Enterprise Value of Gold Resources Corporation at 30 November 2020
At the share price of US$3.00 on 30 November 2020 and with 71.85 million shares issued on 30 September 2020 according to the financial statements, the market capitalisation of GORO is US$215.6 M.
The financial statements for the quarter ending 30 September 2020 give no detail about outstanding warrants or options. For this reference has to be made to slide 41 of the corporate presentation dated which gives 4.67 million options (no information on the exercise price) and 0.20 million RSU’s. As it is not possible to calculate the net effect of dilution, this valuation has ignored it.
At 30 September 2020 the company had net current assets of US$50.02 million and with negligible debt of US$0.30 M.
Based on the above an undiluted Enterprise Value for GORO of US$165.8 M is derived as shown in Table 5_1
Red Flags
When summarising this report on GORO into a list of Red Flags and Green Lights it becomes apparent that there are technical challenges and opportunities, but also existential challenges and opportunities that the Company has attempted to address in its fashion.
On a technical level, the basic situation is that both asset bases in Mexico and in the US have decent geologies, well-run operations, and are cash generating in this metal price environment. At Aquila, the geological prognosis is that reserves can be doubled to give a mine life out to at least 2029, but no assumption has been made for expanding the resources at Isabella Pearl to extend the mine-life beyond 2023. Clearly, with each year of like-for-like reserve replacement adding ~US$80 M to the NPV5 of the project, exploration in Nevada will be a high priority for the Company.
So far so good. Where the Company struggles on the technical level is in the transition to a more transparent reporting standard and the shift to a new system of disclosure. In the reports, key bits of information are missing, leaving analysts and investors scrabbling for numbers, and being forced to make educated guesses or assumptions. Improving transparency would make understanding the investment case easier. In a world where information is key, a Company that is transparent and easily understandable will outperform a Company that is opaque and hard to decipher.
On a strategic level, the greatest challenge faced by the Company has been the dividend policy. On so many levels it has created problems for GORO. How can it be maintained? Are investors wedded to it? What role does it play in Company’s identity? Ultimately, the ability (or lack thereof) to maintain a sustainable dividend has split the company into two separate entities.
Now that the decision to split the company has been made, clarity of thought can return, and the valuation can start to trend back to a truer version of net asset value. Well, first of all the split needs to take place. And then a second wave of selling needs to be weathered, while investors cash in their ‘free’ share. Only then will the EV/NPV trend higher from its current levels of 0.53x towards the peer group at around 1x.
Keep an eye out for free cash flow and exploration news from Aquila, and exploration news and free cash flow in Nevada. These two factors will be the driver of value for GORO shareholders.
To read the FULL report, for FREE, please subscribe below.
- Notification By Email When Our Latest Notes Are Published With Immediate Access As Soon As They Go "Live"
- Suggest Future Companies To Be Analysed (Launching Soon)
- Additional Related Notes and "How To's" To Aid You On Your Investment Journey.
Already a subscriber? Sign in